June 25 GDP Surprise Market Update and Stock Scan
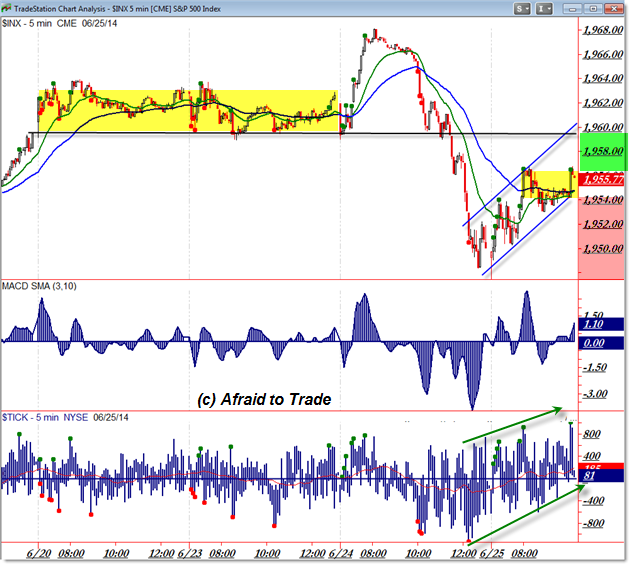
The S&P 500 is retracing the losses from yesterday’s Morning Bull Trap and afternoon collapse toward 1,950.
Price is rallying up off the 1,950 pivot and we’re watching the current 1,955 level.
Let’s highlight the updated structure and pay close attention to the key levels in play:

After yesterday’s sell-off, we’re seeing a push back into the sell pathway with a ‘flag’ or rising parallel trendline pattern.
A “breakout buy” or continuation bullish swing triggers above the 1,956 current level (it targets 1,960) while a bearish sell-signal pathway opens under 1,954 (flag and price support).
We’re neutral between 1,954 and 1,956 for a reference area (note the June 20 and 23 sideways rectangle pattern).
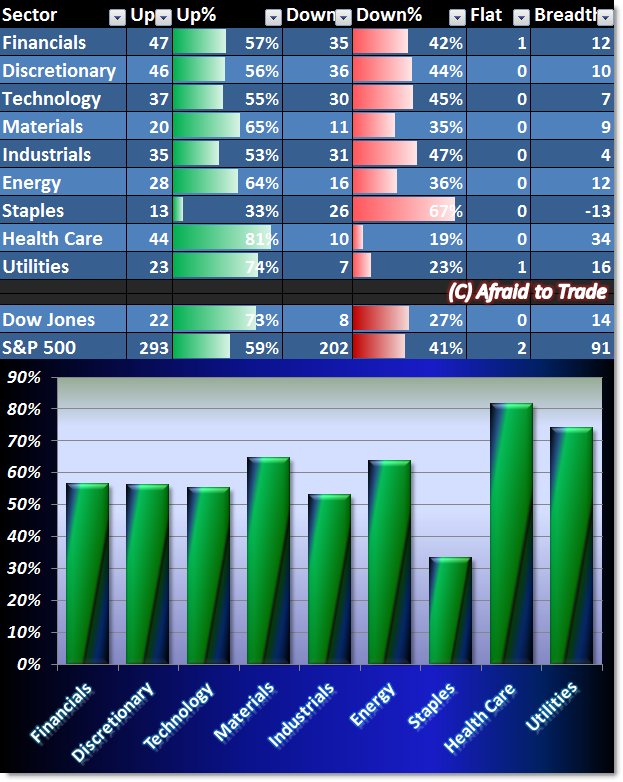
Our Sector Breadth Chart is mixed bullish during today’s rally session:

While we’re seeing relative strength in the defensive sectors of Health Care and Utilities, we can see across-the-board positive performance that is roughly stable (just above the 50% positive level) in all sectors except Staples.
The message is mixed but we’ll label it “mostly bullish” due to the broad positive performance.
Despite the mixed signal, there are always bullish candidates to trade from our scans:

Bristol-Myers SQUIBB (BMY), Monsanto (MON), CBS Corp (CBS), and C.R. Bard (BCR)
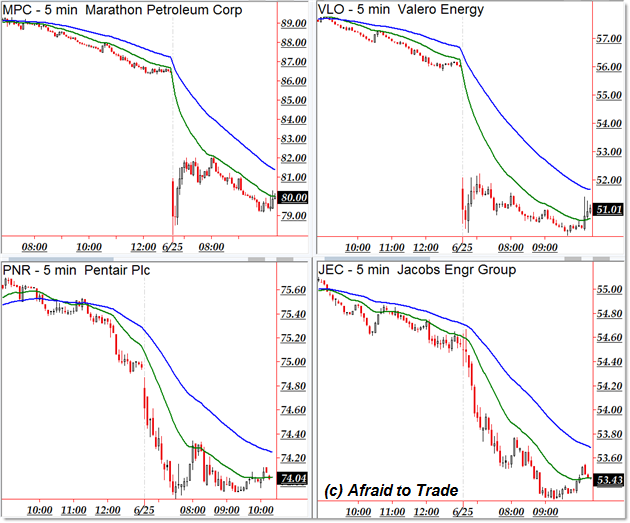
Bearish candidates include the following:

Marathon Petroleum (MPC), Valero Energy (VLO), Pentair (PNR), and Jacobs Energy (JEC).
Follow along with members of the Daily Commentary and Idealized Trades summaries for real-time updates and additional trade planning.
Corey Rosenbloom, CMT
Afraid to Trade.com
Follow Corey on Twitter: http://twitter.com/afraidtotrade
Corey’s book The Complete Trading Course (Wiley Finance) is now available along with the newly released Profiting from the Life Cycle of a Stock Trend presentation (also from Wiley).

