Key Level to Watch on Weekly and Daily Emerging Markets EEM
The popular Emerging Markets ETF – symbol EEM – is currently sitting on key weekly and daily support, or more specifically, a key turning point in structure, so let’s take a look at this level and the immediate targets to watch depending on what happens here at this key point.
First, the Weekly Chart shows the level we’re watching:

Keeping it simple, the rising 20 week EMA is situated at $45.60, which is the “last” price we see on the chart above. That means price is currently sitting atop the rising 20 week EMA.
The last time price swung to this level was during the November 2010 pullback where this level held support.
In the event that buyers cannot hold support here, then we’re likely to see a price play down to test support at the rising 50 week EMA which currently resides at $43.22. That could be an opportunity for short-term traders.
Of course, should support hold, the bullish play is for a move back to $48 if not to new recovery highs.
Those are the weekly parameters – though I show a past instance where price supported twice off the 200 week moving average in 2010 (not closing under this level – though lower candle ‘shadows’ formed).
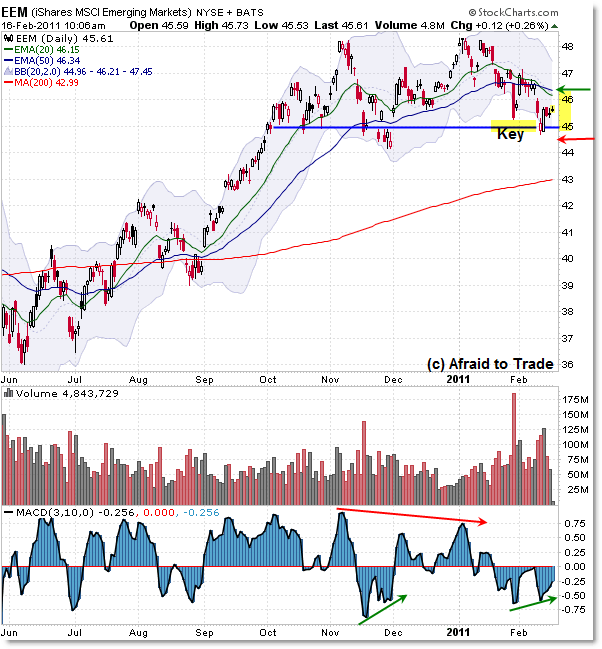
Anyway – let’s move on to the daily chart to see the shorter term parameters:

Again, the short-term key level is at the $45 to $45.50 zone.
The daily chart shows that $45 itself has been a prior price support zone with the exception of a little ‘trap’ in November.
Price has thus stagnated in a range between $45 and $48 per share, which makes this a consolidation rectangle at best and a head and shoulders type distribution/bearish pattern at worst.
The daily 20 and 50 EMAs have crossed bearishly and form nominal resistance at the $46 level where they have crossed. That doesn’t mean price is dead in its tracks, but it’s something to watch should a rally develop.
A breakthrough above $46 means the bulls won the supply/demand battle and that the weekly chart support trumped the daily chart EMAs and that the next move would be expected to take us back to $48.
Otherwise, a clean breakdown here under $45 then the little price low at $44 would be a bearish signal wherein we would expect the downside play mentioned above to the 50w EMA at the $43 per share level – which also happens to correspond with the rising 200 day SMA.
I think it’s fascinating when different timeframe EMAs converge like that – at least it gives structure and parameters to watch as price swings develop in real time.
Of course, a big breakdown under $43 means something else bearish is going on and that would be a major chart turning point signal – so watch that.
Otherwise, keep focused as to what happens here at the $45 and $45.50 areas to determine what to expect from the next swing in price – up to $46 then $48 … or down to $43 (at a minimum).
Corey Rosenbloom, CMT
Afraid to Trade.com
Follow Corey on Twitter: http://twitter.com/afraidtotrade
Order your copy of The Complete Trading Course (Wiley Finance) now available.

Corey.. I would be optimistic if it is able to break above the 10 day MA.. here.. It has been hitting 10 day MA and then sliding down.. so breaking 10 day MA is very important to me for the next swing up..
Thanks for sharing this post. It is really very informative. Thanks again.