Leading Homebuilder Stocks Daily Resistance Levels to Watch
A lot of traders have been puzzled lately by the strength in homebuilder stocks in the face of some of the worst economic data that just came out about the housing market.
Remember, the stock market is (generally) a leading indicator of economic activity so perhaps the poor news was already “baked into” the price of homebuilder stocks.
Now that a rally has taken place, key leading homebuilder stocks have rallied into critical resistance areas that are “Make or Breaks” between a resumption of a devastating downtrend… or a reversal up to higher prices.
Let’s take a quick daily chart look at the price action of Beazer Homes (BZH), Meritage Homes (MTH), and KB Homes (KBH), and Toll Brothers (TOL) to see each respective overhead resistance level to watch.
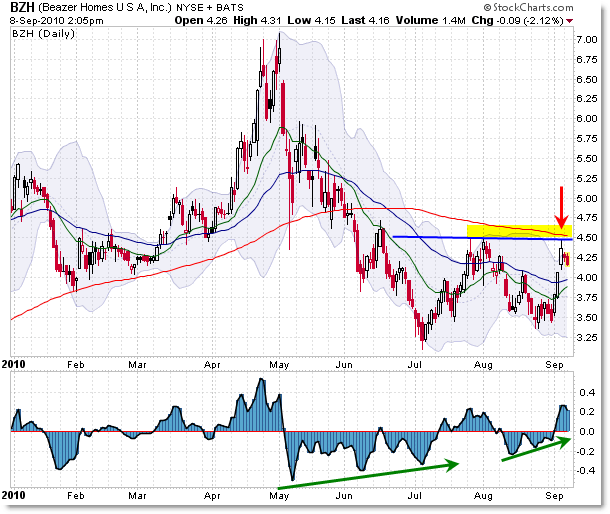
Beazer Homes (BZH):

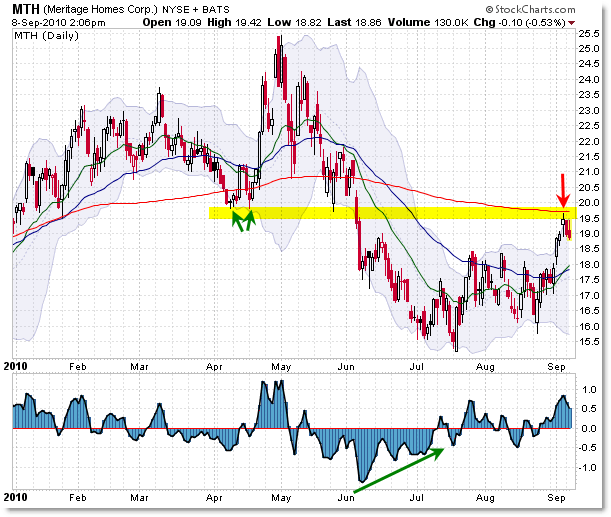
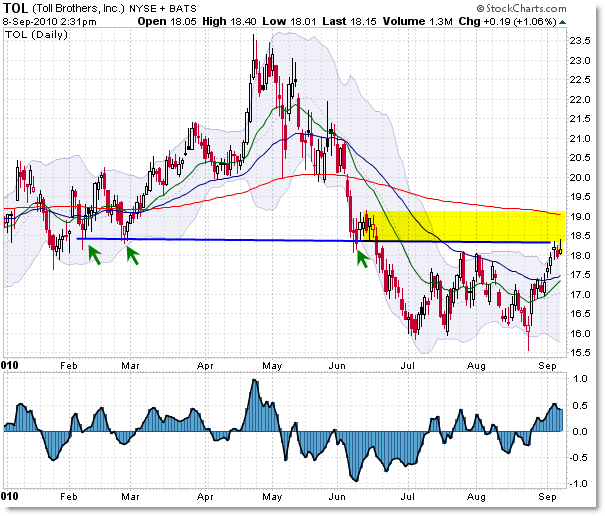
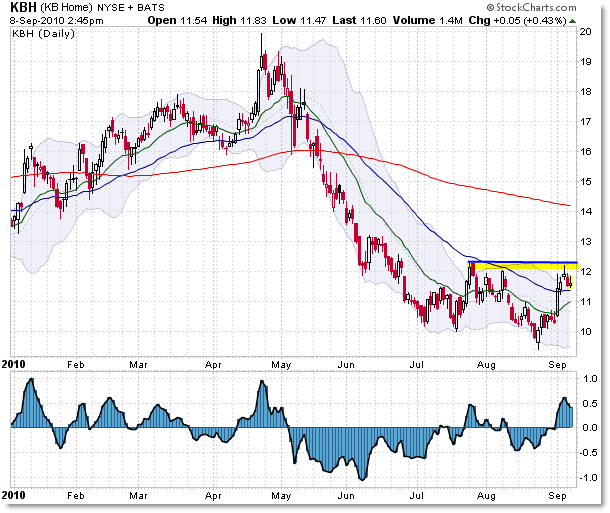
What you’ll see in each of the charts of the homebuilders are the following:
1. Sharp price collapse after peaking in late April 2010
2. Positive momentum divergence and ‘bottom’ in July
3. “Strong” rally so far in September
4. The rally pausing right now into key overhead resistance
That will save you some time in analyzing the charts.
Right now, the most important thing to note on each chart is the respective move into overhead resistance.
In the case of Beazer Homes, the area to watch is $4.50, which reflects a prior price high, trendline, upper Bollinger, and 200 day SMA. Any price push above $4.75 would be a strong bullish confirmation signal that would suggest the strength we see in September will carry price to higher levels.
If not, then lower prices are ahead.
Meritage Homes (MTH):

In Meritage Homes, the price level to watch is the $19.50 confluence overhead resistance area via the 200 day SMA, upper Bollinger Band, and minor ‘polarity’ (prior support) from the April lows.
Any confirmed breakout above $20.00 per share should lead to a continued price push higher – and if not, look to see $18.00 per share or even lower.
Toll Brothers (TOL):

The initial resistance in Toll Brothers is the $18.50 price level, which is both the upper Bollinger Band and horizontal “price polarity” trendline.
By price polarity, I mean that “Old support becomes New resistance,” which exists at the $18.50 level.
Above $18.50 is the key 200 day SMA at $19.00. For reference, any breakout inTOL above $19.00 should lead to a further breakout rally.
KB Homes (KBH):

The resistance level in KB Homes is actually the $12.00 per share level, which is simply the upper Bollinger Band and prior price high from late July/early August.
A nice breakout above $12.00 would be expected to carry price higher to the 200 day SMA at the $14.00 level – so there is a bit more “Open air” on the chart in KBH than in the other homebuilders. This might be something to watch closer.
Keep watching all these stocks for clues if price will breakout above resistance – or fail to overcome the confluence levels above.
It should give clues about what investors think about the broader stock market.
Corey Rosenbloom, CMT
Afraid to Trade.com
Follow Corey on Twitter: http://twitter.com/afraidtotrade

Thanks Cory. You make the charts meaningful to me.