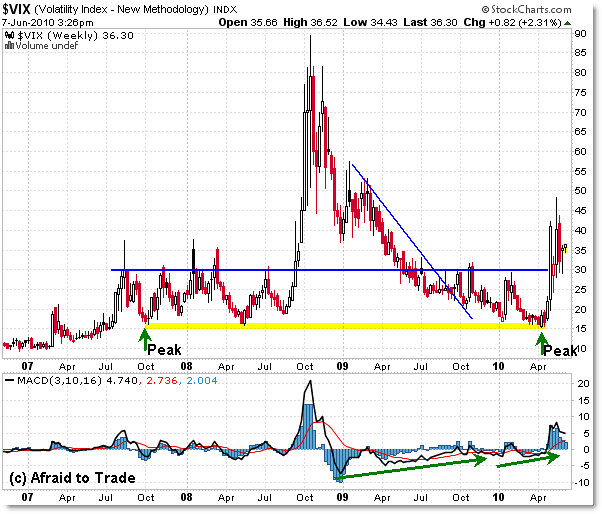
Long Term View of the VIX from Crash through Recovery
With Volatility increasing in the stock market, investors/traders are paying more attention to the Volatility Index, or the VIX.
Let’s take a look at the key reference levels, starting with the 2007 market peak to the 2009 market bottom, and the recent April 2010 market peak and draw some interesting comparisons.

The VIX is also known as the “Fear Index,” and reflects the market’s expectation of 30-day volatility (implied volatility).
A sharply rising VIX correlates with a market that is in a freefall with traders ‘panicking,’ while a low VIX represents periods of calm/complacency where the broader markets are rising comfortably.
If we look at key turning points in the S&P 500 and compare what the VIX was reading at the time, we can get insights on the important “Fear” index and what may be in the mind of traders… and what that might mean for the future.
Case in point, at the market peak in October 2007, the VIX read just above 15. The market began to fall, but not precipitously, and so the VIX remained in a range of 15 to 30 as the market began its transition to the downside.
The bottom fell out in September/October as the market fell straight down in a panic sell-off phase, and the VIX touched 90 at the height of the crisis.
Though the market fell to lower lows in November 2008 and finally bottomed in March 2009, the VIX never reached the highs of 90 – the market drifted lower instead of plunged lower.
At the March 2009 low, the VIX read 50 and has steadily fallen as the market ‘creeped’ its way higher through 2009.
The VIX actually hit a new low not seen since before the 2007 peak, touching 15 (slightly lower than October and May 2008) at the recent market highs… and the market has since turned down in a sell-off mode that included the “Flash Crash” which sent the VIX back to the 45/50 area.
Because the markets have a tendency to fall harder/faster than they rise, the VIX, in turn, has a tendency to experience sudden spikes up, and drifts down (unlike the market which tends to drift up and then spike down).
The VIX currently rests near the 35 level during the recent short-term consolidation between S&P 500 values 1,100 and 1,060.
Keep watching the VIX to see if any new price lows under 1,040 – should they occur = are confirmed with new VIX highs – that would be a bearish confirmation if so.
If you don’t watch the VIX actively, take a brief moment to familiarize yourself with the index and how it can help you assess volatility conditions in the S&P 500/broader market.
Corey Rosenbloom, CMT
Afraid to Trade.com
Follow Corey on Twitter: http://twitter.com/afraidtotrade

Nice chart.
Consolidation as we predicted two weeks ago. After that and above resistance expect very strong upside.
Chart here http://followmarketrend.blogspot.com/search/lab…
Enjoy you week and thanks
Reminiscences of a Stock Operator, Chapter VIII, page 88 of my book. “Obviously the thing to do was to be bullish in a bull market and bearish in a bear market.”