March 8 View of India’s Nifty Index
Let’s take a look at India’s Nifty Index both on a Weekly and Daily view and look at an alternate Elliott Wave count and vital support and resistance numbers.
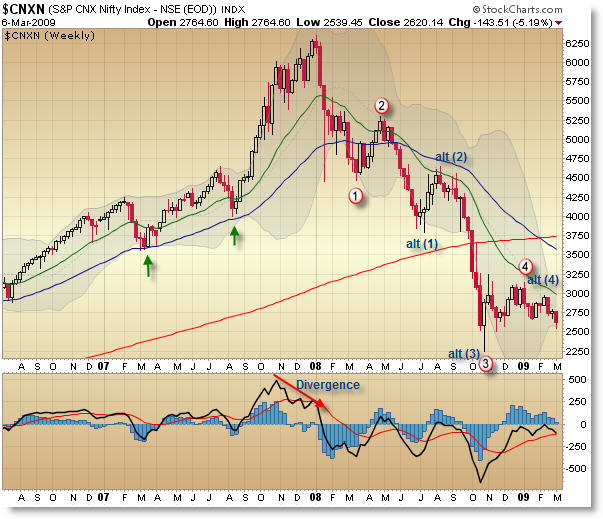
$CNXN Nifty Weekly:
I’m going to use this post to explore some possibilities instead of giving an opinion on the likely direction due to the price consolidation.
The Nifty peaked on a negative momentum divergence just as 2008 began which was a few months after the US S&P 500 peaked in October. Price then fell into the March lows forming the First Wave down as the Second Wave took price in line with the S&P 500 to peak just as May 2008 arrived.
At this point, the Elliott Wave count becomes open to interpretation, and I’ve labeled the two dominant interpretations here. The most ‘bullish’ count – which I believe is the primary count until proven otherwise – is that the 3rd Wave ended at the October lows and the 4th wave is either a triangle (see daily chart) or ended just as 2009 began and that we are currently in the major 5th (circled) wave down with the expectation to make new lows or truncate (test) the Wave 3 low at 2,250.
Keep in mind the Nifty is showing relative strength to the S&P 500 as the Nifty has not broken its October/November lows. The new momentum low (and new price low) in October hint that the actual price low is yet to come, and that it will – if it occurs – form on a positive momentum divergence.
The alternate count is far more ominous and bearish, which states that we are currently STILL in the major (circled) Wave 3 down and that we are in (or are missing) a Wave (5) down to complete the major (circled) Wave 3. This count is shown with the blue “alt (1)” labels overlaid on the chart.
The same count and interpretation is open to the S&P 500 as well.
$CNXN Nifty Daily:

Again, on the Daily Chart, I’m showing more the theoretical and am exploring possibilities as to the alternate wave count.
This count has us fractalizing a major (circled) 4th Wave and showing an Elliott 5-wave triangle that took place during the recent price consolidation. The implication is that we are in the (5)th wave currently and are expected perhaps to test the November lows.
What’s interesting is the major level of support at the 2,600 index level and the resistance at the 3,200 level. Price has roughly traded within a 600 point range for the prior four months. We certainly needed a consolidation period to digest the rapid down move into October, but price has built a base or value area around the 2,800 zone.
It’s really difficult to make any sort of prediction or assessment until price breaks above 3,200 or below 2,600. It would seem to indicate that odds favor a downside break, but the downside break is by no means guaranteed. In fact, because that is perhaps the widespread assumption, price could trick (trap) the majority by forcing an upside breakout.
The easiest way to look at the current structure – Elliott Wave aside – is to note that the Nifty is in a consolidation range and to consider playing the break for a possible range-expansion move once a breakout occurs in either direction.
Until we get that range break, trading could be difficult in such choppy conditions.
Corey Rosenbloom
Afraid to Trade.com
Follow Corey on Twitter: http://twitter.com/afraidtotrade
Register (free) for the Afraid to Trade.com Blog to stay updated
Hi Corey,
Great post …. I too believe for any trend to develop, the nifty should break 2500-2550 or 3150-3200. Until then it is a range bound sort of market. What seems even more important and critical is the low on closing basis on 27th october i.e. 2524, though the intraday low was 2252. If nifty closes below 2524, we could see further downside, atleast testing 2252, but I think when we see those levels, it might turn into panic situation when the real capitulation happens, and 2252 might just become an irrelevant level. Till the nifty is above 2524 its just hovering above the dark waters. And by chance if it crosses & more importatly closes above 3150-3200, we could see strong bear market rally all the way upto the 200 day SMA which as of today is at 3624.
Love reading your posts everyday. Keep it up.
Neil,
Good point – it’s just too hard to call right now.
Hovering above dark waters – interesting characterization!
It – like many major market indexes – are just hovering a fine line where just a small tip will result in a big move either way.
Thanks!
Thanks Corey.We in India appreciate your efforts in understanding our markets.A break on the downside below 2524 and sharp OBAMA rally type pullback up to 3200 or maybe even further is very much expected with elections around the corner.
Corey Hi,
Its nice seeing you doing Nifty Analysis too. I have been a regular visitor to your blog…needless to say I did pick a few things from ya.
Btw I noticed since u finished with your CMT, you have taken to Elliots with renewed vigor!
My take on Nifty
http://1.bp.blogspot.com/_88fjmcdhjs8/SbUIOIjVFtI/AAAAAAAABFM/HXapTcA3slM/s1600-h/NF+6th+March+09.png
Not to mention there is also a 800 point triangle which just broke down.Since NOV I have been of a view till 2500 breaks on closing basis the bulls just might have the last ray of hope!
Thanks and Regards
Hi Corey,
Thanx again for ur continuous effort in analysing Nifty. I feel in the downside 2500 level holds the key. Any close below this level can take us to Oct lows and for bulls to get an upper hand we need to close above 3250. Till then we are in a 750 points range.
Regards
Indrajit
I don’t agree with this NIFTY chart – error is in thinking this decline is a big impulse wave. Please see other indices such as HSCEI where it is clear that Asian indices have completed a corrective wave (A completes on 3/18/08, B on 5/07/08, C is probably not done). What you are seeing globally is SPX is completing or has just completed a C wave post a supercycle and all asian indices have just completed wave 2 of a multi-decade bull market. This should make sense also considering the fundamentals of China India vs the US (strong GDP growth even while the rest of the world is in recession, high savings rates, youthful demographics, etc). The shapes of the waves in indices such as HSCEI / HSI are extremely different than that in the developed world indices.
Manoj,
Glad to have you as a reader! Indeed, some things did rub off on my through my 2 year CMT education! I came into it thinking Elliott Wave was bogus and intended just to memorize it for the exams but when I started applying it, it just clicked for me and became a major interest. It’s become a big interest of blog readers as well so it was a virtuous cycle.
Nice analysis – I missed the mini-Head and Shoulders pattern you caught.
It’s just so difficult to analyze while price is in such a lengthy consolidation.
Indrajit,
I agree – it’s so clear on the chart (the support and resistance) but in which direction price will expand isn’t as clear.
Range-bound traders are loving this though!
if NIFTY gets above 3000 in this leg there is no hope for your wavecount showing us in wave 5 right now or any wavecount that shows this decline as an impulse wave. The only hope of even trying to save the idea that this is an impulse wave is to argue that we’re in a 5 month long minor wave 4 of major wave 3, which would be idiotic. This is a corrective wave folks – we are about to witness a massive bull market in Asia.
HEY COREY AMAZING ANALYSIS, YEAH THE IS PLAYING WITH EVERYBODY.. LETS SEE WHAT HAPPENS AND MY FRIEND IM STILL LEARNING AND NEEDED UR HELP
WHAT IS THE MACD SETUP USED IN WEEKLY CHARTS COREY, IS IT 12,26,9 OR WHAT COZ AT STOCK CHARTS.COM THE DEFAULT SETUP IS 12,26,9 WHICH DOES SHOW THID NEGATIVE DIVERGENCE…. WHAT SETUP HAVE YOU USED…. THNX A LOTT COZ IM STILL LEARNING AND YOUR BLOG TEACHES A LOT…
SORRY TO PUBLISH MY NAME WITH MY COMMENT AND BY SETUP I MEAN PARAMETER
THNX AGAIN HOPE REPLY SOON
hey corey, g8 work man …
please tell me what MACD setup you have used….. IS IT 12,26,9……..
PLEASE REPLY
Sorry Corey, your count is clearly wrong. NIFTY is above 3k. This is a corrective wave, and it seems like Prechter agrees with me:
http://www.elliottwave.com/freeupdates/archives/2009/03/23/Indian-Stocks-Urgent-Opportunity-Announcement.aspx?code=cg
http://www.bloomberg.com/apps/news?pid=20601080&sid=a_EOAMoVs7gE&refer=asia
Let me give you some advice: Stay away from the street and keep trying to count Elliott Waves without paying attention to anything else. There’s a reason Prechter runs a website and guys like Tudor Jones who use EWT as well as fundamentals are rich. Right now EWT, fundamentals, and psychology are all bullish – nobody believes China and India can grow without the US while Q4 GDP data is showing otherwise (China 6+, india 5+, US -6 Annualized). Buy FXI and ride China’s $2tn of FX reserves, positive GDP growth, and $700bn (soon to increase) stimulus package up wave 3. You should have a clear trade from here to at least 1.618 * $75.
excuse me, it would be 75+ 1.618*(75-15)