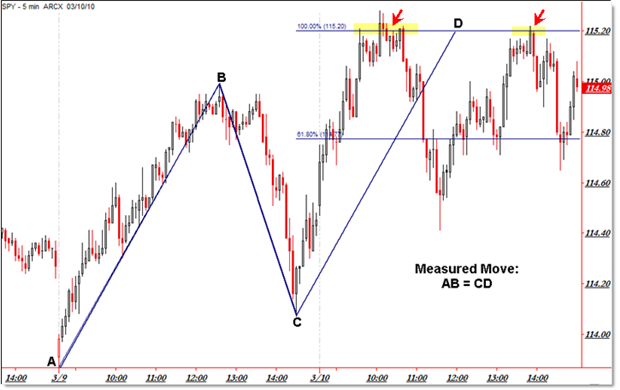
Measured Move ABCD Example in Mar 10 SPY Intraday
I love highlighting Measured Move Patterns (very similar to flags) in the markets due to the price pattern symmetry and structure – each one serves as a great educational reference of this not-so-common pattern.
Fewer people know what an AB=CD pattern is than do a bull or bear flag – though the two patterns are similar.
Let’s take a look at today’s AB=CD Measured Move and see how we could have traded it so we’ll know this concept next time it forms.

First, an “AB=CD” Pattern is more commonly called a “Measured Move,” and it is like a flag (we’ll call this a bull flag for comparison) except for two distinctions:
1. The “impulse” or first leg (flagpole) is often more ‘drawn out’ or takes on a 45 degree angle while the bull flag is more steep/sharp/vertical
2. The Retracement (flag) is almost always deeper than a standard flag pullback
Everything else is roughly the same… but with one more exception in trading tactics.
Most traders only trade the “Projection” of a Bull Flag (meaing the “CD Leg” in the chart above) and that’s usually all you get from a flag – there’s no reason to flip and reverse once a flag completes… but to take profits at the price target.
However, in an AB=CD pattern, some traders will trade the “CD Leg” measured move, while others will wait specifically to see if the pattern completes fully into the 100% Projection Target BEFORE putting on a short-sale position.
In other words, flags focus on the “price projection” leg up while AB=CD moves may focus on that, but mainly focus on the retracement down from the “D” target.
Confusing?
Take a moment to read over the information at my “Bull and Bear Flag” section as well as:
How to Project a Measured Move of a Bull Flag.
In the pattern above on today’s chart, a “Measured Move” Trader would be looking to short-sell any weakness (reversal candle, divergences, etc) at the $115.20 target, which was established by making a Price Projection from the “C” low (keep in mind that these labels are not Elliott Wave notation).
There actually were two opportunities to short at the $115.20 target – the first being the morning swing that formed upper shadow dojis just beyond the target, and the second chance being the afternoon bearish engulfing (like) candle before 2:00 CST.
Take a moment to study these opportunities and the “Measured Move” structure above, and see if this pattern – again similar to a flag – would be a nice fit to your trading style.
I described this pattern – and other intraday opportunities – in greater detail in today’s “Idealized Trades” member report.
Corey Rosenbloom, CMT
Afraid to Trade.com
Follow Corey on Twitter: http://twitter.com/afraidtotrade

Corey, ex-post, we can always fit the price action according to a given chart pattern. Do not u agree?
TA in general is about pattern recognition, and the more patterns you study and observe and learn from, the better you'll be to act on patterns you see in real-time.
That's the point of studying charts.
The S&P on March 10, 2010 closed at 114.93, which is a double high of its January 11 trade olf 114.73.
Your chart shows how the S&P's closing value is in the middle of a broadening top pattern; Street Authority says, when you see the Broadening Top, the market will soon drop. I expect the S&P to drop very very soon.
In fact the S&P, could turn lower on March 11, 2010 as a lower price of oil, USO, copper, JJC, lead, JJN, lead the energy producers, XLE, and energy service providers, OIH, and the metal produces, XME, lower; especially on announcement that the Bank of China is taking measures to reign in inflation. The chart of USO, JJC, JJN, XME, and OIH, should be the canary in the S&P coal mine. http://tinyurl.com/yhtdf8g.
I have no credentials and do not serve as a finanical advisor, yet I am very concerned about a coming liquidity sqeeze, where one may not be able to get one's money at the brokerage service or at the money market account, I strong encourage one to invest in British Sovereign coins, in the GLD ETF, GLD, in a trust account and at Bullion Vault.com
TA in general is about pattern recognition, and the more patterns you study and observe and learn from, the better you'll be to act on patterns you see in real-time.
That's the point of studying charts. No two patterns are identical.
The S&P on March 10, 2010 closed at 114.93, which is a double high of its January 11 trade olf 114.73.
Your chart shows how the S&P's closing value is in the middle of a broadening top pattern; Street Authority says, when you see the Broadening Top, the market will soon drop. I expect the S&P to drop very very soon.
In fact the S&P, could turn lower on March 11, 2010 as a lower price of oil, USO, copper, JJC, lead, JJN, lead the energy producers, XLE, and energy service providers, OIH, and the metal produces, XME, lower; especially on announcement that the Bank of China is taking measures to reign in inflation. The chart of USO, JJC, JJN, XME, and OIH, should be the canary in the S&P coal mine. http://tinyurl.com/yhtdf8g.
I have no credentials and do not serve as a finanical advisor, yet I am very concerned about a coming liquidity sqeeze, where one may not be able to get one's money at the brokerage service or at the money market account, I strong encourage one to invest in British Sovereign coins, in the GLD ETF, GLD, in a trust account and at Bullion Vault.com