Monitoring Long Term Resistance in the Russell
While the NASDAQ recently crested above both its 2011 and 2007 (before the recession) high, the Russell 2000 – an index mainly of small-cap stocks – struggles to overcome its key long-term resistance level.
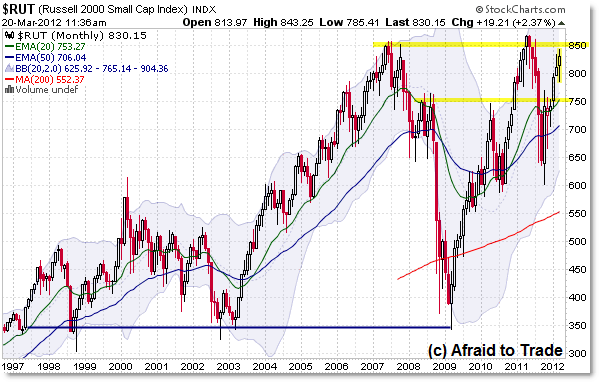
Let’s build the charts and view the key level to watch – for both long-term and short-term planning – in the Russell 2000 Index, starting with the Monthly Chart:

One might call the period from 2003 to present as a long-term Sideways trend, or range-style index.
The alternate interpretation – especially from an intermediate term standpoint – is to refer to 2003 to 2007 as a bull/up-trend, 2008 to 2009 as a bear/down-trend, and the current move from 2009 to present as a continuing bull/up-trend that’s taken the index back to the 850 to 860 overhead resistance barrier.
However you define the trend structure, two index areas should jump off the chart at you:
- The 850 to 870 High (856 in 2007; 868 in 2011)
- The 750 Level (Polarity – mainly resistance from 2008 to present)
With that in mind, let’s now drop to the Weekly Chart:

Price formed a multi-month Distribution Top from February to July 2011 ahead of the “August Crash” which ended at the 600 index level.
From there, price has resumed its longer-term uptrend, though not as strong as the Dow, S&P 500, or the NASDAQ – all of which have traded above their respective 2011 highs.
Nevertheless, the intermediate trend remains structurally bullish due to the series of higher highs and higher lows along with positively-sloped EMAs.
Short-term traders may do best to plan contingencies – and thus trades – based on the current picture in the Daily Chart:

We use the higher frames to show us key levels (either to use in targeting or in finding resistance/support) and the lower frames often give opportunities to trade within those levels (moving toward, or away from, a key index target).
For now, that short-term upper resistance level clearly exists near 835 to 840 while a broader support area has developed at 760.
The flat/falling 200d SMA also aligns near the 760 index level which was resistance through late 2011.
Quite simply, we’ll be watching for one of two developments:
- The Bullish Case is that the index breaks above 840 and travels towards the 850 or even 860 higher timeframe targets.
- The Bearish Case is that the index can’t break resistance, stalls, and begins trading lower towards the 760 support target.
In the meantime, we’ll assess real-time developments within this context (index levels).
Corey Rosenbloom, CMT
Afraid to Trade.com
Follow Corey on Twitter: http://twitter.com/afraidtotrade
Corey’s new book The Complete Trading Course (Wiley Finance) is now available!

Looks like if the Russell 2000 Index starts consolidating at current price levels, we might have good support there and would go higher.
Interesting to see over the last week that the Russell is consolidating in a channel but the S&P 500 has not. Will be watching this week to see if the Russell can break out of the channel.