Morning Market TICK Divergences April 13
Passing on a quick 1-min chart of the SPY (S&P 500 ETF) to show that we’ve already had three major TICK Divergences and a 5-wave Elliott Pattern. Let’s see those quickly:
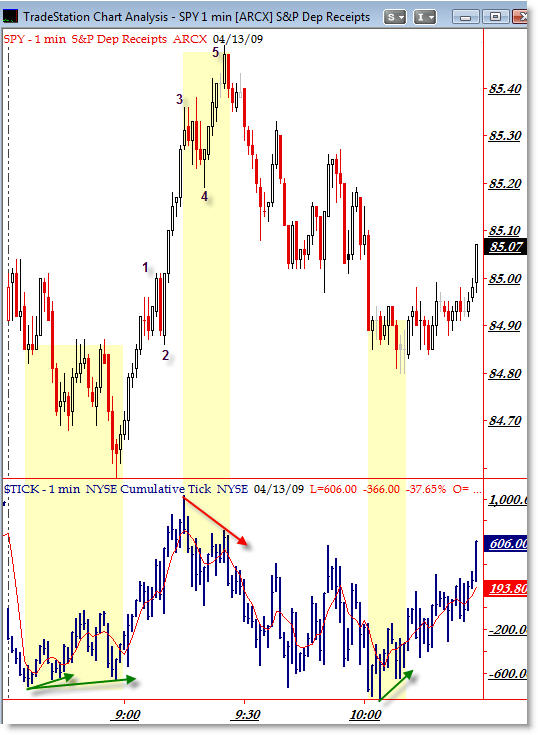
We had a quick “Three Push” Pattern down off the morning’s opening gap (the “Three Push” is a popular reversal pattern) and then we had an immediate burst in a 5-wave impulse structure into the (so far) intraday highs.
The 5th wave and push to new highs formed on a negative TICK (and momentum – not shown) Divergence, which set-up an excellent and aggressive short-selling opportunity.
Price made a push down, though this time a positive momentum divergence formed shortly after 10:00am (CST) which preceded the recent short-term rally we’re experiencing.
I’m mainly showing these as interesting educational patterns and to encourage you to incorporate the TICK into your trading for market ‘internal’ or ‘under the hood’ insights to enhance your trading.
Corey Rosenbloom
Afraid to Trade.com
Follow Corey on Twitter: http://twitter.com/afraidtotrade
Travel to the LA Trader’s Expo in June to hear Corey speak on “Idealized Trades for Intraday Traders”
Corey what can you say about the fact that the low price, so far, was made on a tick reading well above -1000 and the low tick reading, again so far, was made on a price well above the prior low?
I tend to discuss divergences because they’re easier to explain and show on a graph, but you’re hitting a deeper insight path which is that the range (and extremes) of the TICK on a given day often reveal much clearer insight as to the bias or direction unfolding for the day… and/or strength/conviction of buyers/sellers.
It implies that the day could continue higher unless we get negative TICK extremes because there could be a higher floor (bottom) under the negative TICK side and a higher ceiling for the positives. This would imply a bullish/upside bias again until proven otherwise.
Corey, I know you use MACD as one of your momentum measures. There is an indicator actually called momentum, but I’ve not experimented with it…have any opinion of it? Also, what else(besides MACD) would you put in the momentum category? I should say, I am not fully understanding of the meaning of “market momentum” yet, so please forgive if I mangle these concepts.
Awesome blog dude, keep it goin’!
Charles,
Thanks for your question and comment!
Momentum to me is a concept, not an indicator. It’s based on the “Price Pulse” principle, that of “action leads to re-action.” Push/Counter-push. Temporary imbalance in supply/demand.
Any momentum oscillator/indicatore can show you the Price Pulse (impulse), but my favorite way is by comparing two moving averages (differential – MACD) at different points in time.
You can also see it with a standard ROC (Rate of Change) or traditional “momentum” indicator, or the like. Sometimes it can even be seen with RSI.
Basically, you’re not looking at overbought/oversold oscillations, but comparing highs and lows in the indicator with price.