NASDAQ Breaks to New Highs on Relative Strength
If you’re an S&P 500 or Dow Jones only trader, you may be missing the fact that the NASDAQ broke out to new highs this morning and the Russell 2000 index is close on its heels to its own fresh new breakout (while the S&P 500 and Dow lag behind).
Let’s chart the breakout and then compare a “Relative Strength” chart to highlight what’s going on behind the scenes.

I just posted about the S&P 500 this morning so be sure to view the background beyond the NASDAQ from this morning’s post.
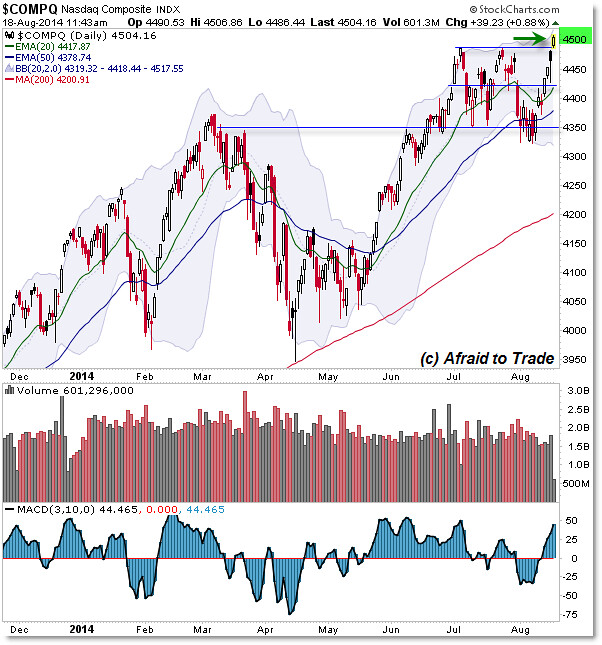
The NASDAQ gapped and trended higher (trend day so far) above the resistance cluster into 4,490.
At this moment, short-sellers are losing money and are rushing to buy-back to cover losses (which – perversely – helps propel the index even higher as more short-sellers are forced to buy-back to cover losses).
New breakout-buy signals are triggering for bulls as well, resulting in a potential “feedback loop” of upside price action.
As long as price remains above this pivot point, buyers are firmly in control of the market.
An alternate “reversal” or Bull Trap thesis would trigger IF the index stalled and reversed violently under the 4,490 level (reference March 2014 for a “bull trap” and reversal outcome after a break to new highs above the 4,250 index level).
The Tech-Heavy NASDAQ is showing relative strength when compared to its sister indexes:

I’m showing the real-time futures contract data of the @ES futures and @YM Dow Mini futures, both of which are trading up into the prior price high achieved in mid-July.
Compare the Red Highlight (how far price is under the high) to the Green Highlight for the @NQ NASDAQ and the near-touch of the prior high in the @TF Russell.
A simple way to chart “Relative Strength” is to compare indexes relative to a prior price high and note how far – often in percentage terms – current price is from the reference point.
It’s generally seen as a bullish or “Risk-On” sign when the tech-heavy NASDAQ and small-cap Russell outperform (even temporarily) the S&P 500 and Dow Jones – which is occurring now.
It does argue that the S&P 500 (and Dow) could play “Catch-Up” as noted in this morning’s post.
As long as we see these indexes continue their upward price pathways, then higher highs may easily be achieved and our alternate thesis – surprise outcome – is thus a sudden bearish reversal.
Corey Rosenbloom, CMT
Afraid to Trade.com
Follow Corey on Twitter: http://twitter.com/afraidtotrade
Corey’s book The Complete Trading Course (Wiley Finance) is now available along with the newly released Profiting from the Life Cycle of a Stock Trend presentation (also from Wiley).

