Nov 12 Update and Stock Scan Down from the Highs
“And now, for something a little different.”
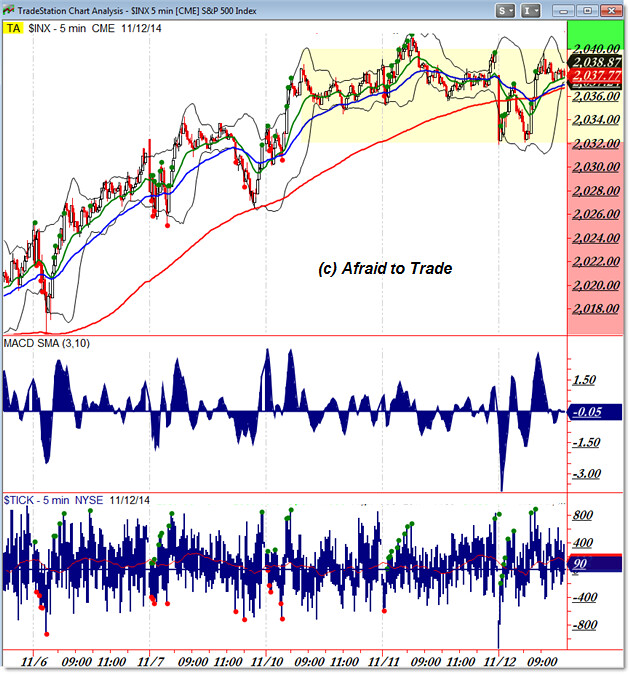
Stocks have traded sideways into the 2,040 S&P 500 level and we can define a short-term range for our trade plans.
Note this morning’s market update on the magic of the 2,040 level and how we’re planning around it.
Here’s our updated levels as the S&P trades through all-time highs:

Our short-term reference levels include the 2,032 price support (double bottom today) along with the 2,040 resistance in the S&P 500.
We’re simply pro-trend breakout (short-squeeze) bullish on an impulse above 2,040… bearish for a possible breakdown (short-term reversal plays) under 2,030, and neutral to trade “ping-pong” between this 8 to 10 point range.
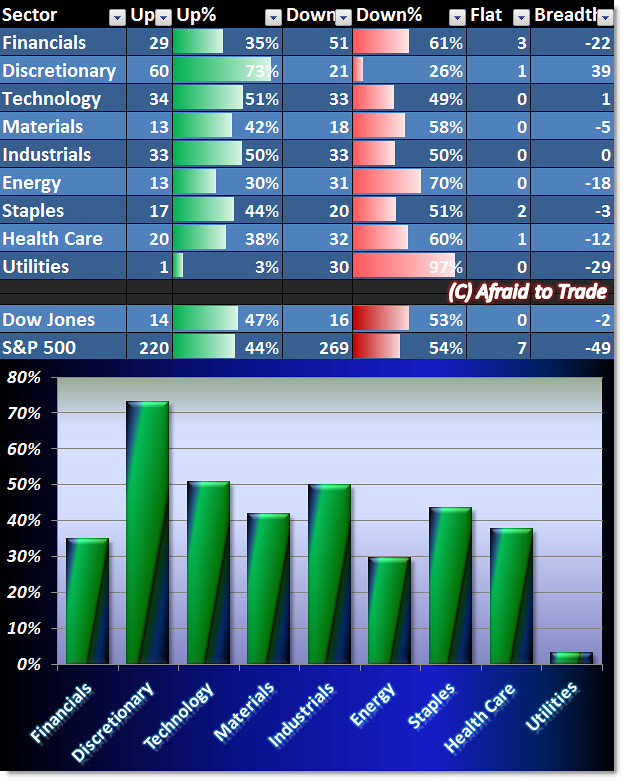
Breadth is slightly mixed – much like the market at the moment:

Despite the down or sideways price action this morning, our Sector Strength chart is actually flashing a very BULLISH message.
Strength of the day resides in the Offensive or Bullish sectors, particularly Consumer Discretionary, Technology, and Industrials.
Our weakest sector – surprisingly – is the Utilities group which reveal only one of thirty stocks positive right now.
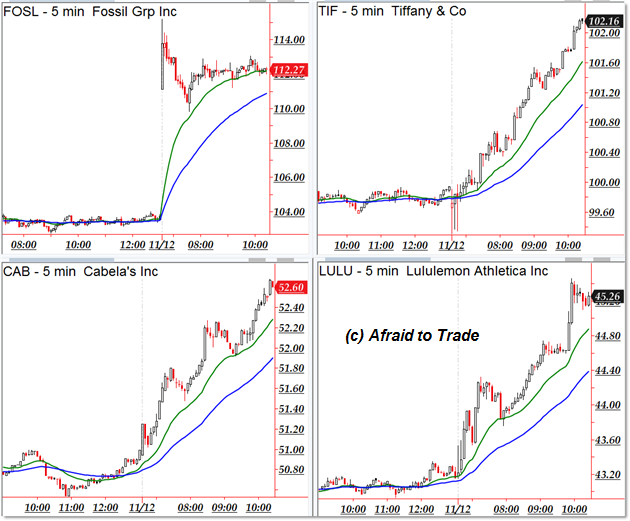
We have potential bullish trend continuation plays in the following stocks:

Fossil Group (FOSL), Tiffany (TIF), Cabela’s (CAB), and Lululemon (LULU).
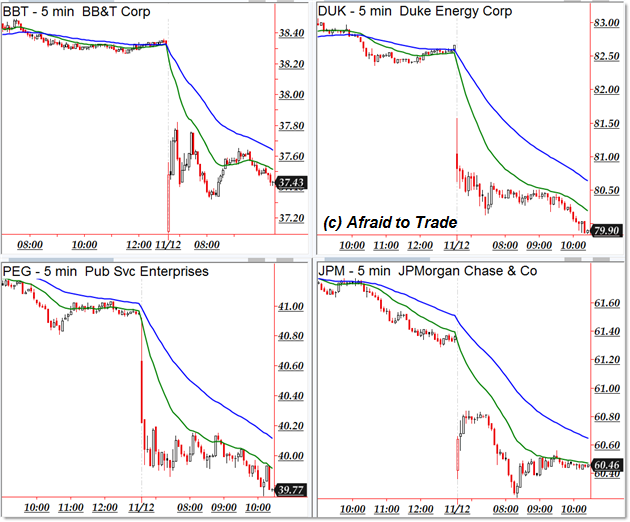
Potential downtrending candidates exist in stocks showing relative weakness today:

BB&T (BBT), Duke Energy (DUK), Public Service Enterprises (PEG), and JP Morgan (JPM).
Follow along with members of the Daily Commentary and Idealized Trades summaries for real-time updates and additional trade planning.
Corey Rosenbloom, CMT
Afraid to Trade.com
Follow Corey on Twitter: http://twitter.com/afraidtotrade
Corey’s book The Complete Trading Course (Wiley Finance) is now available along with the newly released Profiting from the Life Cycle of a Stock Trend presentation (also from Wiley).

