NVIDIA NVDA Faces Critical Support Test Now
Once high-flying stock NVIDIA (NVDA) faces a make-or-break support test or it risks entering a trend reversal and period of distribution.
Let’s plot our development and pinpoint what level is our key focal point:

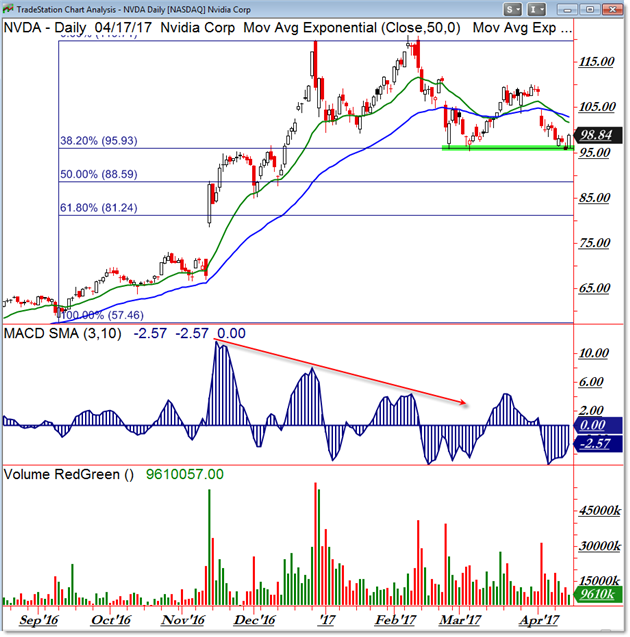
NVIDIA traders experienced a big run-up in 2016 (it frequently topped our “Strong Stocks Getting Stronger” scan for members) but then stagnated in 2017.
Namely, price formed a “Double Top” price pattern just above the $115.00 per share level.
Negative divergences (red arrow) in Momentum and Volume also set the stage for a stall and possible reversal.
For the moment, buyers defended the $95.00 per share level which is a simple Price Pivot and the 38.2% Fibonacci Retracement as drawn.
If you’re trading this stock and forming a game plan, have a neutral to sideways (bullish bounce right now) plan between $95.00 and the $115.00 level.
Otherwise, develop a bearish breakdown (short-sell) plan on a departure away from $95.00 toward lower target levels such as $88.50 and $81.25 (or even the future gap fill near $70.00 per share).
Whatever happens, it should be interesting and hopefully profitable for you.
Follow along with members of the Afraid to Trade Premium Membership for real-time updates and additional trade planning.
Corey Rosenbloom, CMT
Follow Corey on Twitter: http://twitter.com/afraidtotrade
Corey’s book The Complete Trading Course (Wiley Finance) is now available along with the newly released Profiting from the Life Cycle of a Stock Trend presentation (also from Wiley).”

