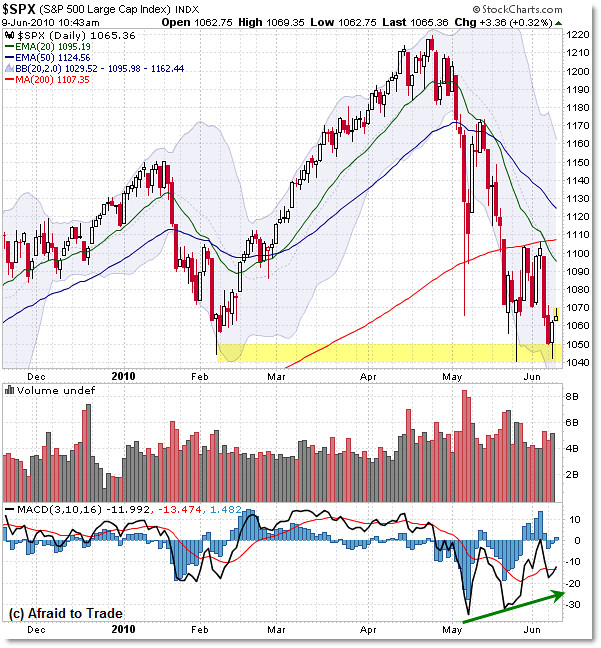
Third Time’s a Charm? SPX Tests Line in Sand
They always say “The Third Time’s a Charm,” but will that be true as the S&P 500 once again tests its major line in the sand between bull and bear?
Let’s see:

I cannot underscore how important the 1,040 level is to technical analysts – a break under this level officially turns the price structure on the daily chart to a downtrend using all major trend reversal classifications, including:
A “Death Cross” in the 20 and 50 day EMA
Price closing under the 200 day SMA (some use this alone to define downtrend)
Lower High, Lower Low, price breaking Lower Low (from February)
Remember, a downtrend is defined as a series of Lower Highs and Lower Lows – and a break under 1,040 locks that definition in place.
Plus, the TV Media will report on a “Break in the market to new 2010 lows” which could further spook nervous investors, causing them to sell stocks in their portfolios.
It could also trigger a wave of short-sellers putting on positions on a confirmed close under a critical support level.
But all of that hasn’t happened YET.
As of today, the bulls/buyers have successfully defended the key level, and as long as that’s the case, the market structure could hold up and come back literally from the edge of an abyss.
This is why it’s important to watch “Line in the Sand” turning points (prices) in the market that serve as reference levels.
I’ve been discussing this repeatedly each evening in my daily report for subscribers, so check that out for additional analysis as we get new data from each day’s activity.
See my prior posts on the Line in the Sand:
S&P 500 Poised on the “Edge of a Cliff”
Edge of Cliff Level to Watch in the Russell 2000
You can almost feel the tension from both bulls and bears at this level – so continue to watch it very closely.
Corey Rosenbloom, CMT
Afraid to Trade.com
Follow Corey on Twitter: http://twitter.com/afraidtotrade

Could you take a look at SPY @1998 in 15 years chart, Is there similarity here? Not sure the support is @ 95 or 105?
What is your take on the daily SPX candle today?
The 1,040 level has been incredible over the last eight months. I also find it particularly interesting that 1,043 is the top of the yearly pivot range. Therefore, not only is there visual support, but pivot support as well – which forms a very nice area of confluence. The Dow has the same relationship as well…It will be very interesting to see what happens…
Cheers!
Frank
You just have to love the 1218-1228 confluence area on the weekly $SPX that lead to the current downtrend. Technicals rock!!!!
Through experience it always seems that the A corrective wave down (following the completion of a 5 wave uptrend) finds support at the previous wave 4 pivot low, in this case the 1040 area.
Well , the view of the passage is totally correct ,your details is really reasonable and you guy give us valuable informative post, I totally agree the standpoint of upstairs. I often surfing on this forum when I m free and I find there are so much good information we can learn in this forum!