Updated Elliott Wave Count on NASDAQ
With many Elliott wave practitioners puzzled at the current wave count, here is a possible mainstream interpretation of the latest Elliott Wave Count on the NASDAQ, which has had the most impressive run-up off the March 2009 lows.
(click for larger image)
As a caveat, keep in mind this is only one interpretation.
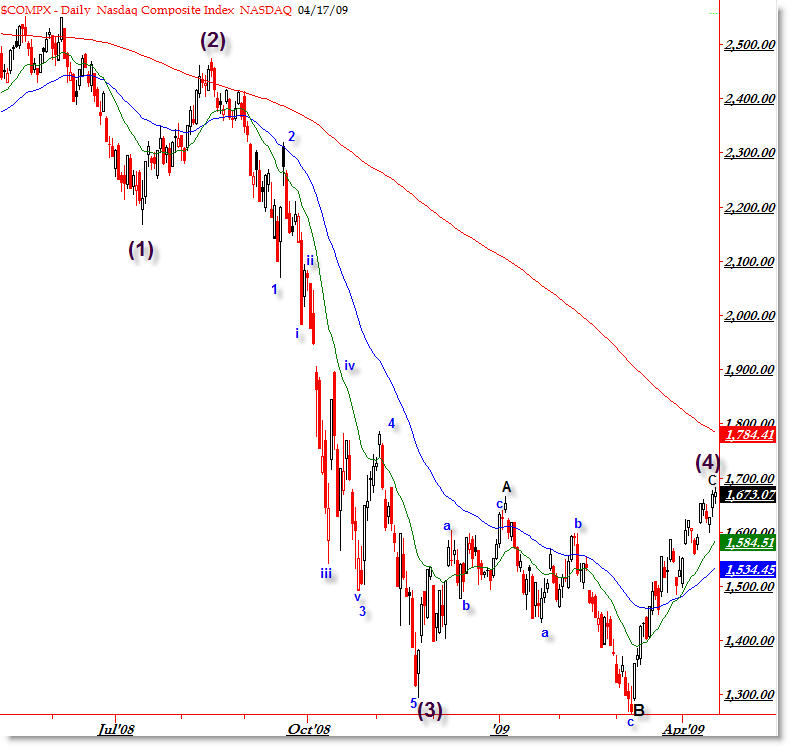
This count assumes that we are perhaps completing a 4th Wave retracement (specifically an ‘expanded flat’) that is fulfilling the corrective wave nature. This is a simple wave count, without involving “X” waves and other complex concepts in Elliott lingo.
What’s surprising is the strength of the rally off the March lows, prompting some to call this a strong impulse wave. Whatever the case, it looks like the gas is running out of the current swing, as a dominant ‘wedge’ pattern is forming across all equity indexes. You can almost ‘feel’ the price running too far, too fast.
There’s no guarantee price will fall here, and any bear who has tried to call a top so far has been embarrassed, so keep in mind that markets can run higher than people think they can (or go lower than they think they can) so don’t try to outsmart the market – take what it gives you and do the best you can with the data you have at the time.
Corey Rosenbloom
Afraid to Trade.com
Follow Corey on Twitter: http://twitter.com/afraidtotrade
Travel to the LA Trader’s Expo in June to hear Corey speak on “Idealized Trades for Intraday Traders”
Beautiful. A gap right in iii of 3 of (3). Each wave 4 ends in the territory of the fourth of one lower degree. Wave v of c of (4) was a bearish ending diagonal. If correct, this count will be verified by a sharp move lower very soon.
Thanks Andrew!
This appears to be the dominant pattern, though it almost seems too easy to count.
This seems also to fit the “Alternation” principle, in terms of 2 being sharp and 4 being flat.
Should know Monday/next week whether or not we get a swift down-move off this or not!
Can that B below 1300 go lower than the low of 3rd wave? Is it valid EW?
Another interpretation is this: we had 5-waves down, we are having a big correction A-B-C (we are currently in A which is in itself 5 subwaves) followed by another 5 waves down. What do you think? I mean a secular bear market can have not 1 sequence of 5 waves down, but 2 or even 3!
Wow! This made my jaw drop! I’ve been looking over the S&P for the past few months, trying to figure out what’s been going on. The December move up was a reactive double zigzag, and the subsequent move down to 666 was an obvious three as well. This move up could count as either a three or a 5, but I’d like to see a larger reactive move for it to be an A-B-C.
Regardless, I didn’t buy the December move up as a complete wave 4 for the same reasons as you. Wave 4 is usually longer than wave 2 and usually alternates with it.
The drop to 666 in the S&P was far too big to be Wave B of an expanded flat, so I was looking towards the last move down either being the end of wave 3 (ignoring that it doesn’t look impulsive) or the second wave of a symmetrical triangle.
I think we’re looking at a running flat in the S&P. Running flats are rare. Wave B descends way past the start of Wave A. Wave C falls short of Wave A. Perfect, and I feel a lot more comfortable with it if the corresponding move on the Nasdaq is also a three.
Here are the alternates:
1) We could be in a running triangle
http://twitpic.com/3hqio
2) We could have just finished wave 1 of a more conventional flat. http://twitpic.com/3jm36
Here’s my chart of the running flat, which is what I think is the most likely possibility.
http://twitpic.com/3k6dm
The B wave of an extended flat can indeed go beyond the end of the prior impulse wave and that last move down was clearly a three and thus part of a bigger correction rather than a fifth wave.
Dacian,
Hmm.
Yes, in an Expanded Flat (also called an “irregular”), wave B can exceed the peak of Wave 5.
Well. Remember, correctives take the form of 3 waves and impulses take the form of 5 waves. There can be fractal components but let’s keep everything in context.
2000-2003 was Wave A; 2003-2007 was Wave B; and here we are in Cycle Wave C down which will have 5-waves. If this count is correct, then we’ve met four of those 5-waves in C.
I don’t see any other way that we make repeated impulse (5-waves) waves down from here.
Steve,
Right, the 3-wave structure in A and B leap off the chart at you.
We’ve either finished the 5-waves as Andrew said, or this whole structure (off March lows) was an “A” wave with B to come (NOT making a new low) and C to come (making a new high for 2009).
I toy with that count but it would be just so disproportional (time-wise) with Primary Wave 2 up in May.
You nailed it – I felt really uncomfortable with such a short W4 but with the data we had, that was the count. Now it’s making more sense, luckily.
I really love how you’ve color-coded and traced out the waves. I encourage all readers to check out his charts.
Ugh – I hope this doesn’t wind up being a hideous triangle.
Sorry-one of the sentences of what I wrote should be “We could have just finished wave A of a more conventional (i.e. reular or expanded) flat.” I said wave 1, which could throw people off.
Hi Corey,
As I analyze DJI rather than NASDAQ, at current level there is one resistance at 8121 and another at 8504. I am just looking at another possibility that at current level where you are showing end of wave wave 4, is not the possible end of wave 4, and it is at the upper resistance at 8504. So from current levels , there may happen a minor retracement downwards, and then market goes on to touch the upper resistance at 8504 to complete the end of wave 4. And then it may come down like a free fall.
What do you say?
that has been my veiw for quite some time, on the S&P the Nov. low is a 3 and the rally to 743 an “A” a “B” down to 666 now we’re in a “C” of 4 a running flat where “C” does not move beyond “A” also look at GOOG and GS on a 2 year weekly chart both look like they are finishing “4”‘s example of a running flat: http://thepatternsite.com/EWRunning.html
I keep looking at C of (4) and it just doesn’t count out well as a five like the C wave in a flat should. The alternatives are a rare expanding triangle for these rare times or a simple W-X-Y combination; either would alternate with the sharp(2). Fortunately, from a trading perspective, all of these possible counts imply the next move is down (and soon).
I like your article and it really gives an outstanding idea that is very helpful for all the people on web.
stock Tips
great post for stock market investors and i suggest
opt2wealth for stock tips, wealth management and wealth creation in different
other ways
title=”optiontips”>share tips