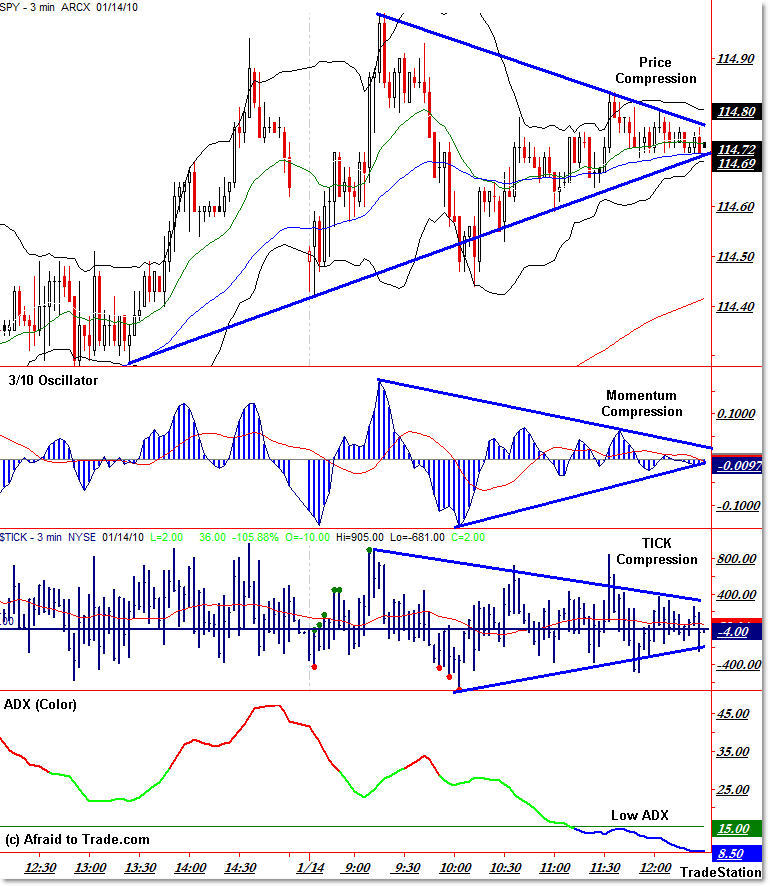
Price Compression Forecasting Intraday Break Jan 14 SPY
I wanted to show a quick chart of the current mid-day SPY (S&P 500 Index) on January 14th to highlight a good example of price compression/consolidation which is often a precursor to a price breakout in one direction or the other, according to the “Range Alternation Principle.” Let’s take a look at the current intraday chart.
The main idea is that price alternates between periods of range expansion and range contraction, and consolidations often precede breakouts (and range expansion moves often end in a consolidation period).
Theory aside, let’s take a look at not just the price, but some of the indicators that help us identify price compression periods.
1. Bollinger Bands (Look for a Compression or visual tightening in the Bands)
2. Unbound Oscillators (such as the 3/10. Look for compression in highs and lows)
3. Intraday TICK (the TICK can show compression in highs and lows)
4. ADX (Ave. Directional Index – A value under 15 indicates price compression)
5. Basic Trendlines
These are some of the helpful tools to use.
Compressions are known as “Value Areas” in Market Profile terms, and some traders thrive on trading breakout moves from such areas.
Keep a close eye on any break of the price above or beneath the Bollingers and trendlines I’ve drawn to play for prior highs ($115.00) or prior support lows ($114.50 and below).
This will serve as a good educational example regardless.
Corey Rosenbloom, CMT
Afraid to Trade.com
Follow Corey on Twitter: http://twitter.com/afraidtotrade


I think, INTC and JPM earning is going to give a run in either direction. If you take seasonality in consideration (as mentioned here http://cobrasmarketview.blogspot.com/2010/01/01… ), then my bias is bearish; but again this is not a market where things go as expected. Did I just whispered manipulation?
I think, INTC and JPM earning is going to give a run in either direction. If you take seasonality in consideration (as mentioned here http://cobrasmarketview.blogspot.com/2010/01/01… ), then my bias is bearish; but again this is not a market where things go as expected. Did I just whispered manipulation?