Price Percent Change Graphs of BP XOM and COP After Oil Spill
After a major incident involving the stock price of a particular company, it’s always interesting to take a look at competitor companies to see how the incident has affected the share prices of related companies.
Did it have a similar affect across the whole sector… or was it contained to the price of one particular stock?
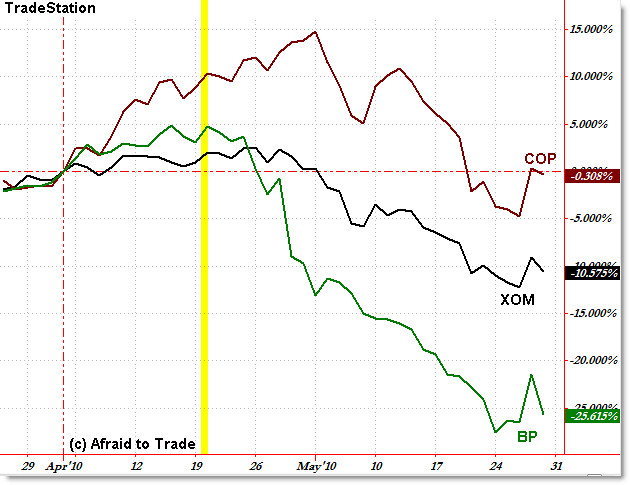
Let’s take a quick look at BP in the wake of the Deep Water Oil Spill crisis that began with the initial explosion on April 20th, and then track the percentage changes of its competitors Exxon-Mobil (XOM) and ConocoPhillips (COP):

The chart above shows the percentage change of three stocks: BP (green), Exxon-Mobil (black), and ConocoPhillips (red).
Instead of starting the comparison (zeroing out the changes) on the day of the initial oil rig explosion, I started the percentage change from April 1st, which will allow us to look at the price percentage performance of these stocks for the last two months.
I drew a highlighted vertical bar to show the day of the initial rig explosion.
What’s happened?
Unsurprisingly, BP’s stock has fared the worse of its two main competitors, having declined over 25% from April 1st.
Exxon-Mobil’s stock is down 10%, while ConocoPhillips remains unchanged for the two month period.
While disastrous, the negative effects so far seems to be concentrated on the share price of BP, as funds and investors unload the stock.
For reference, the broader energy sector ETF – XLE – is down just over 9% from April 1st, which is in line with Exxon-Mobil.
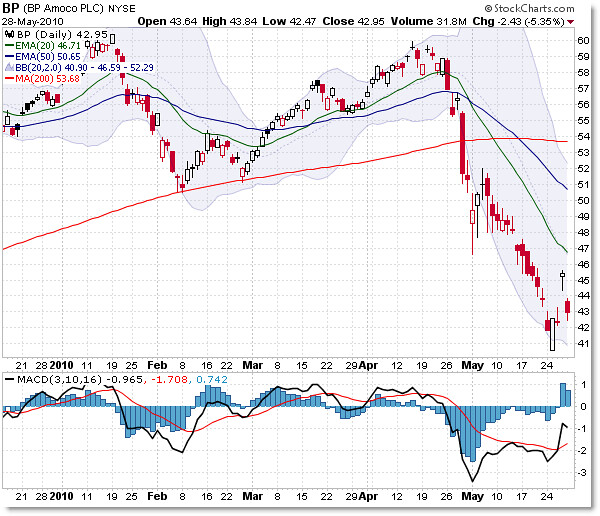
For reference, here is a daily chart of BP that dates back to the start of 2010:

BP actually traded in line with the S&P 500 even after the initial oil rig explosion, peaking just under $60.00 per share.
The initial crash in BP’s stock price – as fingers were pointed and blame assigned – came on April 29th, a week ahead of the stock market’s “Flash Crash” of May 6th.
The chart should remind us not to attempt to catch a falling knife (meaning, don’t try to buy to find a bottom in a stock that is falling very sharply).
After the three-day rally that took us to May 6th, BP’s stock price fell 13 days in a row before forming a bullish candle and short-squeeze that began on May 25th.
With the leak still unplugged, and the recent “Top Kill” procedure deemed a failure, oil still spilling at an unknown rate into the Gulf of Mexico, and public opinion continuing to decline for BP, it’s assumed we’ll continue to see a decline in the stock price of BP as liabilities continue to rise.
Corey Rosenbloom, CMT
Afraid to Trade.com
Join the RSS Feed Reader for blog posts auto-delivered to you.
Follow Corey on Twitter: http://twitter.com/afraidtotrade

I guess only good thing i can say about this is that $BP was already underperforming $COP..so they were ugly to begin with.