Quick Charting August 15 Internals Ahead of the Open
With the pre-market futures gapping lower under a key support level, let’s step back to see the picture of Market Internals behind the price action.

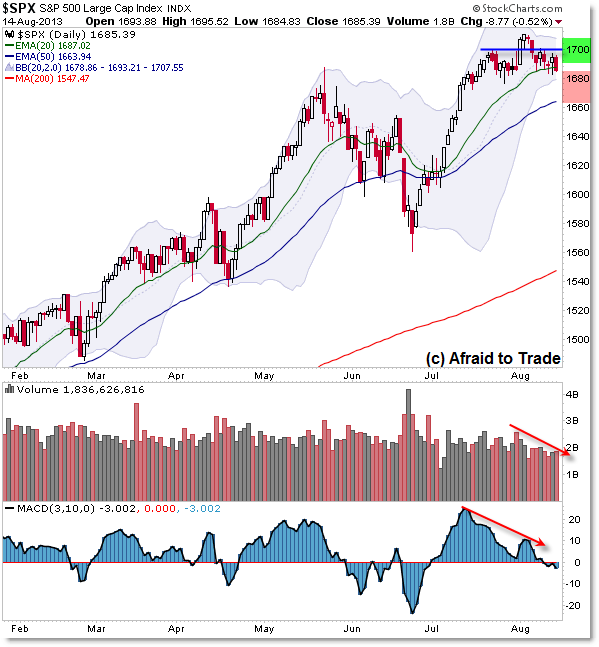
Price has formed a sideways consolidation rectangle pattern between the 1,685 and 1,700 index levels along with a “Bull Trap” or failed breakout above the 1,700 key target.
During August, we have seen two trading sessions with visually positive market internals or “strength” in internals – the first was the August 1st breakout which quickly stalled and failed (again, note the divergences in the highlighted region) and the August 8th gap and rally session.
All other days in August have seen sub-par or outright negative (bearish) indications from Market Internals despite a sideways or flat price movement.
Not event the strong intraday ‘spike’ rally from August 13th was able to generate a visual new high or confirmation in Internals.
We look to Market Internals for clues about the underlying strength or weakness from the broader stock market, particularly for divergences as non-confirmations or ‘spikes’ as confirmation of a price movement.
For a bit of background information and more detail (and to see the charts as they happened in real-time), be sure to take a look at my recent prior updates:
“Lessons from the August SP500 Bull Trap”
“Updating Market Internals on Fall from All-Time Highs”
I highlighted the major divergence in the “Big Three” Market Internals on the extremely weak break above 1,700 which did – so far – result in a Bull Trap outcome and return under the 1,700 breakthrough level.
As we’ll see on the Daily Chart below, though a ‘trap’ triggered, buyers aggressively defended price at the rising 20 day EMA level and they appear to be losing that battle this morning:

As I’ve been highlighting to daily members, the key short-term trading plans (intraday especially, but even on the swing trading frame) develop from the rising 20 day EMA and the ceiling of resistance into 1,700.
While that’s been effective from a short-term basis, price will break free of this range and today may very well be the initial breakout session to the downside.
A downside break under the 20 day EMA currently at 1,687 sets in motion a potential play or decline toward the rising 50 day EMA into 1,665 which is also near pivot confluence with the June price high (1,655).
For today’s session and beyond, be on guard for any “Bear Trap” that returns price back above the 20 EMA level.
Otherwise, note the internals and visual divergences suggest a potential sell-off play toward the 1,665 or 1,655 confluence target – any move under 1,655 suggests the market is in a deeper sell-off mode into the “Open Air Pocket” under the 1,655/1,650 level.
Join fellow members to receive daily commentary and detailed analysis each evening by joining our membership services for daily or weekly commentary, education (free education section), and timely analysis.
Corey Rosenbloom, CMT
Afraid to Trade.com
Follow Corey on Twitter: http://twitter.com/afraidtotrade
Corey’s new book The Complete Trading Course (Wiley Finance) is now available along with the newly released Profiting from the Life Cycle of a Stock Trend presentation (also from Wiley).
