Quick Checking SP500 Market Internals Nov 29
What do we see when we look “under the hood” at the market by viewing current Market Internals?
Let’s take a look with the bigger picture and drill down from there:
Click for larger image.
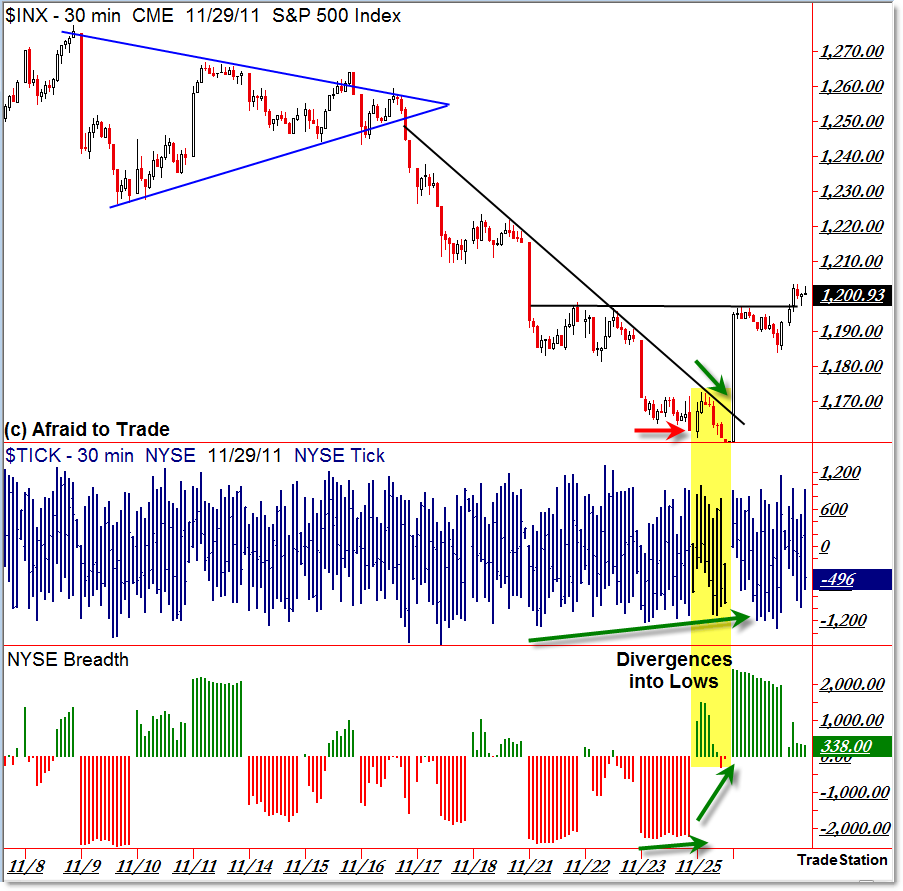
The 30-min intraday chart above gives us the perspective from the recent “Symmetrical Triangle Breakdown” from last week.
New TICK (middle graph) and Breadth (lower graph) lows were supportive of further new price lows during the sell-off.
According to the “Momentum” principle, new internal (or momentum) lows tend to precede future price lows yet to come – you can see how that played out in the chart above.
But no swing lasts forever – Momentum and Market Internal Divergences often clue us in AHEAD of a market reversal which was the case again this time with the Internal Divergences of November 25th’s holiday session.
Look closely to see Breadth turn positive and diverge strongly relative to the new price low under 1,160 achieved on Friday.
This gives a good example of how Market Internals help guide our trading decisions in terms of looking for swing continuation or reversal.
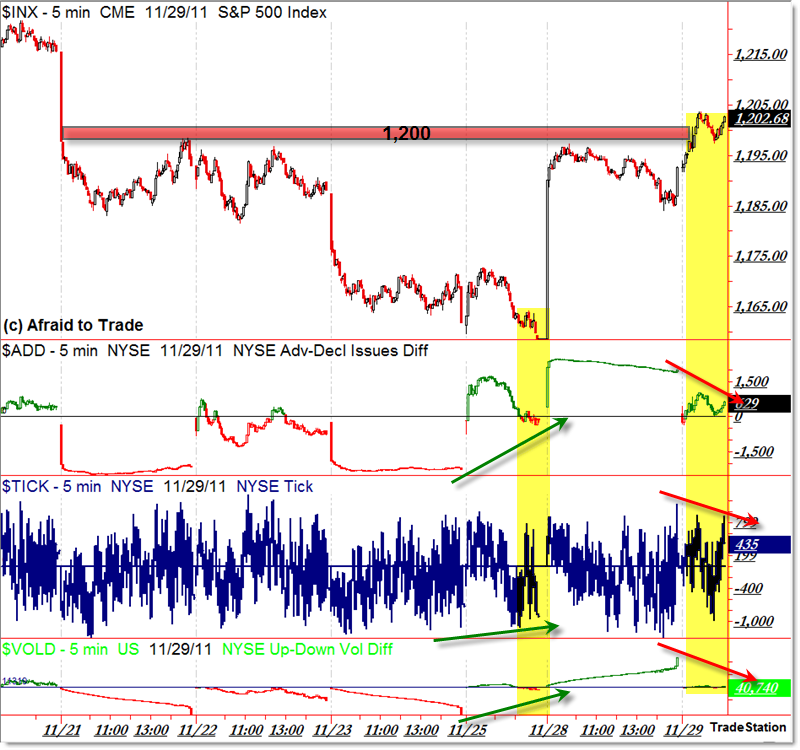
Now, let’s drill down to the 5-min chart to have a closer look at the divergences and see what Internals are saying now:

I’m showing the “Big Three” Market Internals of Breadth ($ADD), TICK ($TICK), and Volume Difference ($VOLD) of Breadth.
Lower timeframe charts often give a clearer picture of what’s happening on a higher timeframe.
We can clearly see the positive divergences in all three Internal indicators at the close of Friday’s holiday session.
Monday – thanks to the ‘good news’ in Europe and with the holiday sales – gave us an initial “power reversal” spike which was confirmed in the Internals.
Again, new Internal/Momentum highs (confirming price) tend to precede future highs, and we see that initial follow-through this morning.
Unfortunately, the “Big Three” Internals are DIVERGING with price as it interacts with the 1,200 key resistance level.
So the current picture is the following:
After forming divergences and reversing back towards the 1,200 target, the S&P 500 is showing internal weakness that we need to be monitoring for any sort of reversal/failure.
That would be the bearish suggestion, though as traders we follow price – everything else just gives us clues of what to expect and how to position/manage risk.
A further price rally above 1,200 – especially if met with confirming (higher) Internals – would be a “Popped Stops” breakaway buy signal that would be expected to continue at least to 1,220’s target, and we’ll see what the picture reveals in Internals if this bullish outcome develops.
If you can do so with your software, continue watching internals relative to these key levels.
Corey Rosenbloom, CMT
Afraid to Trade.com
Follow Corey on Twitter: http://twitter.com/afraidtotrade
Corey’s new book The Complete Trading Course (Wiley Finance) is now available!


Great post