Quick Fibonacci Cluster Targets for S&P 500
With markets in a turbulent/volatile phase on the lower frames, it can be very helpful to slow the pace down by pulling up to a higher timeframe.
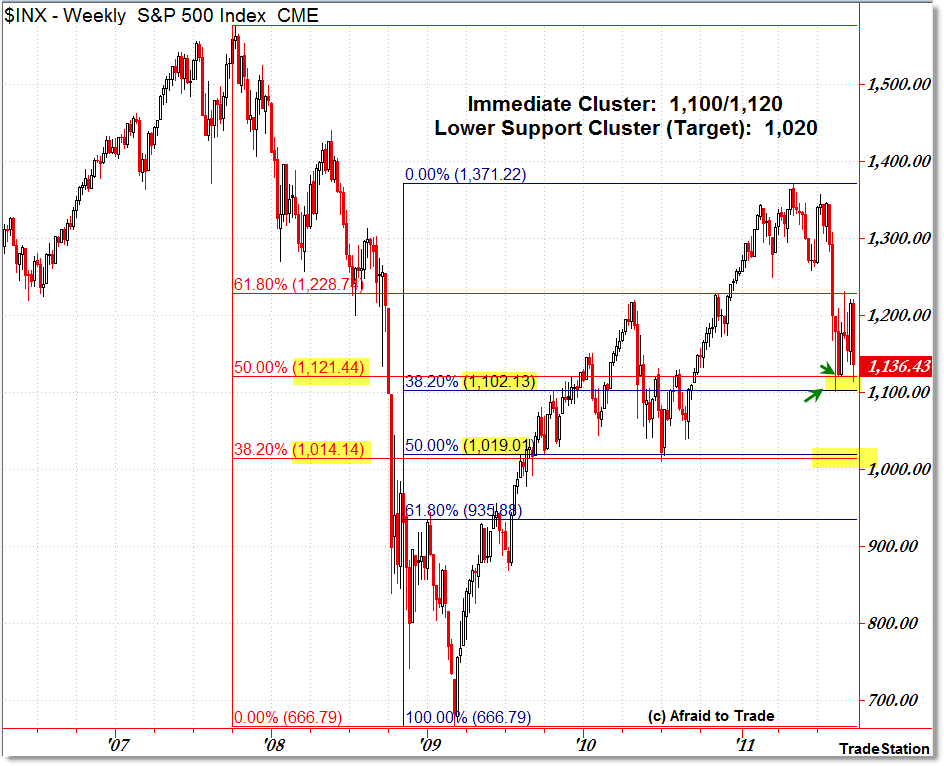
Let’s take a look at two major Fibonacci Cluster levels that help us make sense of the current S&P 500 index activity:

Starting with the larger – red – Retracement Grid, this is the dominant Fibonacci Grid from the “Bear Market” top to bottom as drawn:
61.8%: 1,228
50.0%: 1,121
38.2%: 1,014
Now, moving to the closer – blue – Retracement Grid from the “Bull Market Recovery” phase as drawn:
38.2%: 1,102
50.0%: 1,019
61.8%: 935
A quick glance at the overlapping (clustering) Fibonacci retracements reveals the two dominant index levels:
- 1,100 and 1,120 (which also clusters with the 2011 support lows)
- 1,020 (which similarly clusters with the 2010 support lows – along with 1,040).
Broadly, what this suggests is that if the index cannot hold the Fibonacci support cluster here at 1,100, then we can expect a continuation fall to the lower support cluster – which would become a target under 1,100 – at 1,020.
From this, you can develop trading strategies/set-up along the way depending on whether the immediate 1,100 cluster holds or breaks.
With all the headlines swirling around, sometimes it helps to cut right to simple tactics as much as possible.
Corey Rosenbloom, CMT
Afraid to Trade.com
Follow Corey on Twitter: http://twitter.com/afraidtotrade
Corey’s new book The Complete Trading Course (Wiley Finance) is now available!

Excellent
A whole new use of the word Cluster, nice! LOL
I have read the whole blog and it is really very informative. It is really quite interesting article. Thanks for sharing such type of great things with us.