Quick Lessons from Creeper Intraday Trend Moves
Many traders report difficulty in trading “Creeper Trends” or “Oozing Trends” that neither give reversal signals nor safe entry signals.
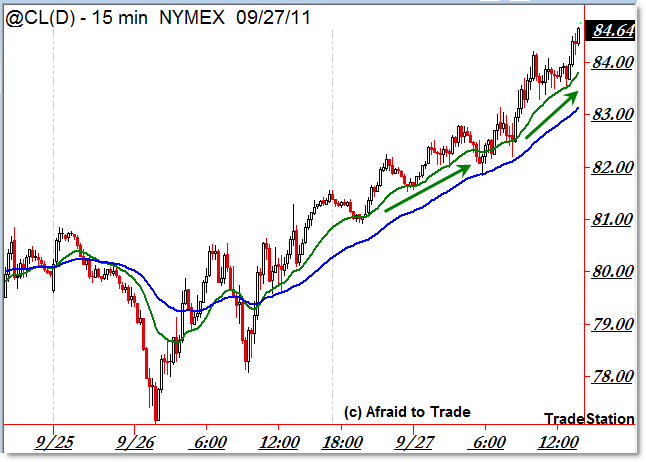
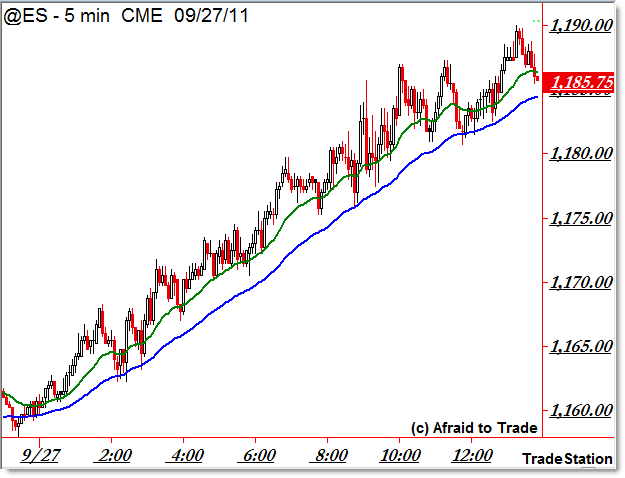
Let’s take a quick look at the @ES (S&P 500) and @CL (Crude Oil) Futures contracts to see the overnight action that provided the framework for today’s continued “creeper” intraday trend moves on September 27th.
First, the Overnight @ES Chart:

Then the similar @CL Crude Oil Futures Overnight Chart:

What’s going on?!
In trading, we call this a “Feedback Loop” wherein bulls and bears are performing the same activity – buying – for different reasons.
In the case of an upside “Feedback Loop,” here is a breakdown of general trading activities:
Bulls/Buyers: Buying contracts so as to profit from an upside move, or are buying to remove a hedge (short-sale)
Bears/Sellers: Buying contracts either by taking stop-losses (painful) or taking profits from earlier position
Almost from a perverse standpoint, the longer the one-sided action lasts, the greater these forces (of buying pressure) become.
It often leads to a climax that results from a combination of buyers exhausting buying power (those who want to buy on the timeframe have bought) or sellers exhausting their short-sold positions).
However, until a reversal in supply/demand dynamics occurs – namely the “Feedback Loop” is broken – price will continue its “Slow Creep” or “Oozing Move” higher which often frustrates all sorts of traders.
Many traders like to buy price pullbacks (retracements) to support in a rising trend, but “Creeper Trends” don’t offer salient/obvious retracements.
Likewise, many traders like to buy breakouts above prior resistance levels to establish a new trade, but “Creeper Trends” don’t retrace enough to develop a meaningful short-term overhead resistance level.
So where does that leave trading opportunities?
From a standpoint of conservative, classical (simple) trading tactics/techniques, it doesn’t – there are neither clean pullbacks nor clean breakout entry opportunities.
Therefore, a classic/conservative chart trader would remain sidelined, missing the move due to no clean/clear entry signals.
Generally, that’s fine because “Creeper Trends” like this are quite rare in the intraday world – we may see them once or twice a month if that.
However, how does one actually trade a Creeper Trending Session?
Trading a Creeper Trend calls for creativity and past experiences with them.
Let’s look at the 5-min @ES Chart:

When faced with the chart above, one can split the intraday trading community into two distinct groups:
1. Those wishing to get long into the trend but not seeing any clean entry spots to do so
2. Those wishing to get short for an eventual reversal… that never seems to materialize
Perversely, those who DO try to fight a creeper trend in motion often wind up CONTRIBUTING to the creeper trend when they take their future stop-loss.
That’s an important lesson in why feedback loops continue – sellers are unable to overcome the buying forces at work, and as a result, end-up buying-back to COVER short-sold (reversal) trades.
So we can develop a hard rule for what NOT to do when you see a Creeper Trend:
DO NOT Fight or Fade it
That rule can save you thousands of dollars – one learns this either from experience or from listening to others who have done so.
However, learning what NOT to do is not necessarily identifying what TO do.
The general strategy almost seems to call for getting long on any number of shallow pullbacks to rising moving averages, trailing a stop under a longer-period EMA, and holding your nose until you’re stopped out via a trailing stop.
I’m showing the 20 and 50 EMA above, though the 10 period or even 5-period EMAs (or SMAs) may work better for some traders (no one EMA or SMA is perfect).
Sometimes it’s effective just to remove EVERYTHING from your charts and simply draw a trendline connecting as many price lows as possible. Establish, or add to, positions on tests (touches) of this rising hand-drawn price trendline. Trail the stop slightly under it.
Ultimately, markets caught in “Feedback Loops” exhibiting Creeper Trend Moves (or oozes) will trump virtually any indicator – oscillators, divergences, reversal candles, Elliott Wave counts (how many ‘terminal’ 5th waves can you count above?), Fibonacci projections, Pivot Points, and so on.
Moving Averages and hand-drawn trendlines seem to work best in these unique environments.
Most classical chart indicators aren’t optimized for feedback loop moves – thus the overwhelming majority will have you avoiding a position (“I just can’t buy when the stochastic or RSI is in overbought territory”) at best or worse, fighting the trend by establishing a fade or reversal trade (we’ve already seen why that’s generally the worst thing to do).
Feedback Loops occur in all markets and all timeframes and they often require adjusting your typical trading strategies – it’s part of adapting to the volatility or characteristics of a market in motion.
Feedback Loops do not last forever, and they often meet a violent reversal/end… but never bet on a reversal UNTIL you see breakdowns under rising trendlines or EMAs where the market has ‘respected’ our “bounced off-of” previously.
Anyway, take a moment to study the charts above along with examples from other related markets today for additional insights about the structure, formation, and movement of “Creeper Trends” intraday.
Corey Rosenbloom, CMT
Afraid to Trade.com
Follow Corey on Twitter: http://twitter.com/afraidtotrade
Corey’s new book The Complete Trading Course (Wiley Finance) is now available!

Thank you so much for this. This is precisely why I have kept out of silver for 2 days and crude today ….