Quick Look at Monday’s Trend Day Up May 18
Wow – what a trend day up for Monday May 18th. Let’s look inside the intraday structure and try to learn some lessons from today’s Type III Trend Day action.
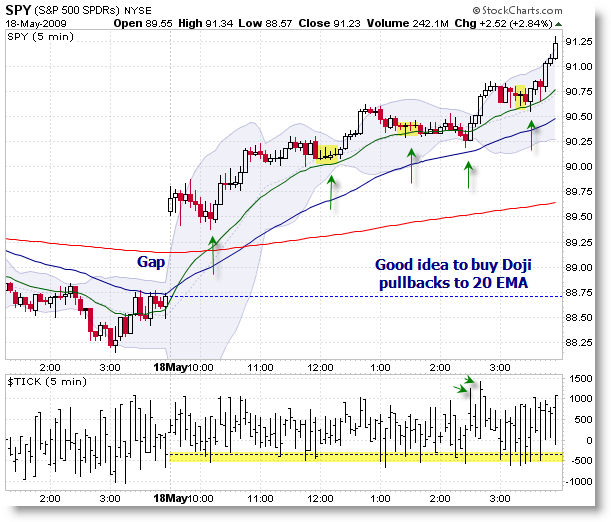
We began the day with a large (though not immense) overnight gap of roughly $0.75 in the SPY and had a slight pullback that formed a decent bull flag set-up slightly above EMA support at $89.50. Those who were trying to fade the gap were met with strong bullish bars at 10:30 as the bull flag worked its way higher. Price then formed a shallow, sideways “ABC” correction into almost four dojis in a row at the noon hour (an excellent, low-risk buying opportunity) as we got yet another push to new highs.
By the 12:30pm afternoon break-out, you should have removed all doubt that we had a Trend Day forming. The TICK had never meaningfully pulled back below zero (on a Trend Day, the zero-line in the TICK in combination with price pullbacks to the 20 EMA set-up powerful trade entries in the direction of the prevailing trend) and price had never meaningfully broken beneath the 20 EMA.
As price dipped slightly beneath the rising 20 EMA at 2:30, we were immediately met with new price and New TICK Highs, hinting that actual price highs were more than likely yet to come – and they did. Notice the +1,500 TICK reading at 2:30 – odds favor buying any pullback after such a powerful reading during a developing and confirmed Trend Day. Sure enough, the expected price high followed after a “gimme” opportunity where a hammer and two dojis (candles) in a row formed. Price subsequently closed at its highs.
If you tried to fade (go short) on this day, or if you would like to learn more on how to optimize your profit on a Trend Day, check out my compilation post “21 Posts on Trend Days” which will be an expanding resource on basic Trend Day education.
Early recognition and knowing what to look for in terms of monitoring the developing structure are key in trading a trend day effectively and maximizing profits.
Corey Rosenbloom, CMT
Follow Corey on Twitter: http://twitter.com/afraidtotrade
Good stuff, as always, Corey.
A question for you: any reason to think that leveraged ETFs have increased the likelihood of trend days vs. reversals and other intraday patterns?
Cheers,
-Bill
Nice analysis.
Where do you get your TICK data/chart from? It doesn't appear that the online brokers offer it. Thanks
Joe
Hello Corey, I was hoping you would anaylze this day. Great reinforcement. Have you ever concluded what the “less likely to fill” gap is for the SPY? I know it was $1.00 on the DIA.
The only other thing I would humbly request is if you could show an elliot wave count on the intraday structure. Thanks.
i personally get it here http://www.quote.com/beta/chart.action?s=%24TICK but im also seeking any other source.
except yesterday at the session start, i notice that there are no divergences with tick last days. so, based on divers with 3/10osc., rsi, mfi, stoch with confirmation of tick diver strategies are out of the game. maybe its imaginary. believe today will get some signal.
except yesterday at the session start, i notice that there are no divergences with tick last days. so, based on divers with 3/10osc., rsi, mfi, stoch with confirmation of tick diver strategies are out of the game. maybe its imaginary. believe today will get some signal.