Quick Updating the SP500 Symmetrical Triangle into December
Gold recently broke from its larger Symmetrical Triangle daily chart pattern, but the S&P 500 (Stock Market) hasn’t followed suit yet.
Let’s update the current “Bigger Picture” Triangle Price Pattern, note key boundaries, and what to expect next.
First, the S&P 500 standard Daily Chart:

A Symmetrical Triangle Price Pattern – or any major consolidation/compression pattern – has the following three components:
- Upper Resistance “Expensive” Line
- Midpoint “Fair Value” Area
- Lower Support “Cheap” Line
This is true also of standard Rectangle Patterns as we saw from August to October 2011 in the S&P 500 recently.
At this moment, these levels exist at the 1,260 confluence with the very important 200d SMA (recent resistance), 1,200’s confluence support, and of course the 1,220/1,230 “Midpoint” Area which has proven important (as both resistance and support).
To keep it as simple as possible, those will be the short-term levels to watch for any sign of a breakout as we turn the corner into 2012.
Triangle Patterns classically forecast a Range Expansion or Impulse (trend) phase after the initial breakout from these boundaries, as we saw with November’s successful Triangle Pattern formation and completion (a really great example).
You can always go beyond price to determine the odds of an upside or downside break (including volume, momentum, internals, etc) but sometimes it’s best to play the pure pattern for a breakout once the market “tips its hand” and confirms movement in a direction (instead of trying to guess which side – bulls or bears – will win).
However you decide to play it (swing, intraday, play ahead of the break, play after the break, play the first reaction after the break), it’s often important to strip the chart of all indicators and focus on pure price structure when planning trading strategies:
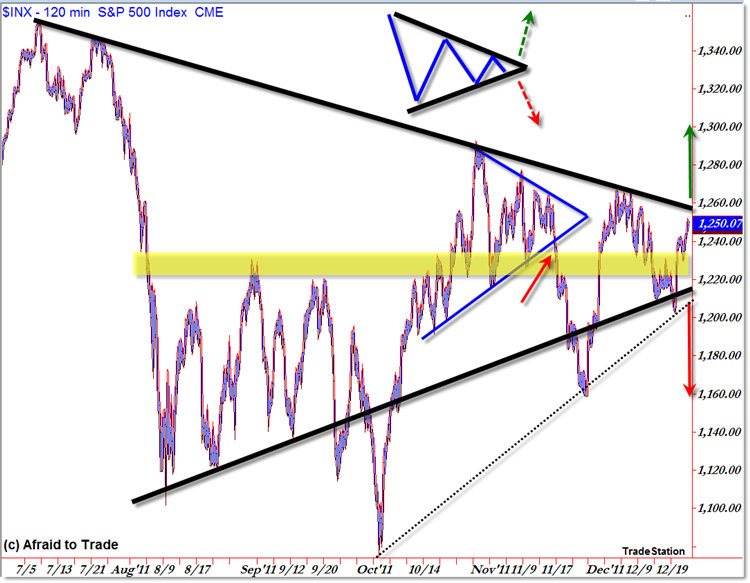
What we’re seeing above is the 120m S&P 500 Chart (for clarity – you could use an hourly chart but the bars get too compressed) with the larger dominant Triangle Trendlines (black) drawn.
I’m showing an alternate, steeper rising lower trendline that accounts for the two “nips” or “false breaks/traps” from the larger – arguably more important – trendline but the end result at the moment is identical: both are converging under 1,220.
I’m also showing the minor/smaller Symmetrical Triangle pattern that developed and achieved its goals in November (blue).
And above the price chart, I’m showing a basic “textbook” Symmetrical Triangle ideal pattern.
Again, the classic expectation is for a range breakout/trending move (price expansion) to develop on a breakout from these compression trendline boundaries (via the “Range Alternation Principle”).
Minimum targets – which could be hit quickly – include 1,300 on the upside and 1,160 on the downside. Further movement beyond these levels expands the playing field for 1,375 (up) and 1,120 or even 1,100 (down).
We’ve had a few good examples lately about similar triangle patterns, so let’s monitor this situation as it develops and be ready to act as needed, depending on our trading stragies and aggression levels (aggressive traders try to position as quickly as possible on a break, while conservative traders prefer additional confirming signals).
Corey Rosenbloom, CMT
Afraid to Trade.com
Follow Corey on Twitter: http://twitter.com/afraidtotrade
Corey’s new book The Complete Trading Course (Wiley Finance) is now available!
helpful. thx!
Great, I really like your analysis style! Thanks for sharing!
Thanks Corey
direction on the triangle decision should be higher i'd imagine.
i have good shorts that haven't moved, from the past couple of days.
i get little pullbacks on them, then the buyers come in.
Are these 20,2 Bollinger Bands on your chart?
Yes, those are the classic/default settings I'm using.