Selloff Market Update and Trending Stock Scan March 25
We have a second sell-session in a row as the S&P 500 moves down from the 2,100 key level.
Let’s update our S&P 500 chart and highlight the strongest – and weakest – stocks on the session:

As the S&P 500 failed to hold the 2,100 level, an slow-moving avalanche of selling pressure (liquidation) crept the market lower. Today’s session sees the avalanche moving quicker mid-day into the current 2,070 pivot level.
We’re using 2,070 – the 61.8% Fibonacci Retracement (not drawn) – as our intraday potential reversal pivot.
The market would be intraday bullish above the 2,075 level and continuation/breakdown bearish under 2,070.
Let’s see what our Breadth Chart reveals about current market strength (or weakness):

There’s nothing at all surprising about weak sector breadth in the context of a sell session.
However, we do see a huge surprise on the chart coming from the strong – almost 100% positive – Energy (XLE) sector which is today’s shining bullish star.
If you’re looking to play bullishly into the close on a reversal, focus on Energy.
Otherwise, pick a sector and trade from the short-side, particularly Technology and Financials.
Here’s a new addition to the daily market update – the Big Point Winners and Losers Grid:

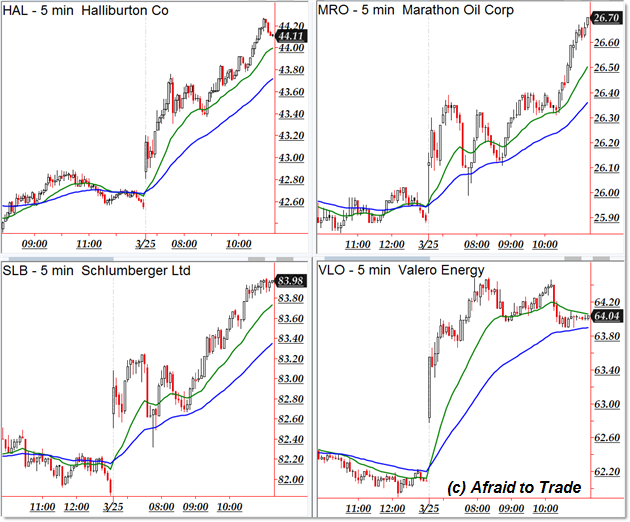
We have potential bullish trend continuation plays in the following stocks from our scan:

Halliburton (HAL), Marathon Oil (MRO), Schlumberger (SLB), and Valero Energy (VLO)
Potential downtrending candidates exist in stocks showing relative weakness today:

Apollo Education (APOL), Nationstar (NSM), Booz Allen Hamilton (BAH), and Texas Instruments (TXN)
Follow along with members of the Daily Commentary and Idealized Trades summaries for real-time updates and additional trade planning.
Corey Rosenbloom, CMT
Afraid to Trade.com
Follow Corey on Twitter: http://twitter.com/afraidtotrade
Corey’s book The Complete Trading Course (Wiley Finance) is now available along with the newly released Profiting from the Life Cycle of a Stock Trend presentation (also from Wiley).


Fantastic post however I was wondering if you could write a litte more on this topic?
I’d be very thankful if you could elaborate a little bit
more. Thank you!