September 3 Expected Rally Market Update and Stock Scan
Odds strongly favored a continuation of the bullish movement from yesterday (see yesterday’s mid-day update and the planning chart with the green arrow pointing higher) and that’s precisely what happened this morning.
Will the bounce continue? Or have we hit a key resistance target level and that’s all we get?
Let’s chart the levels and possible outcomes here:
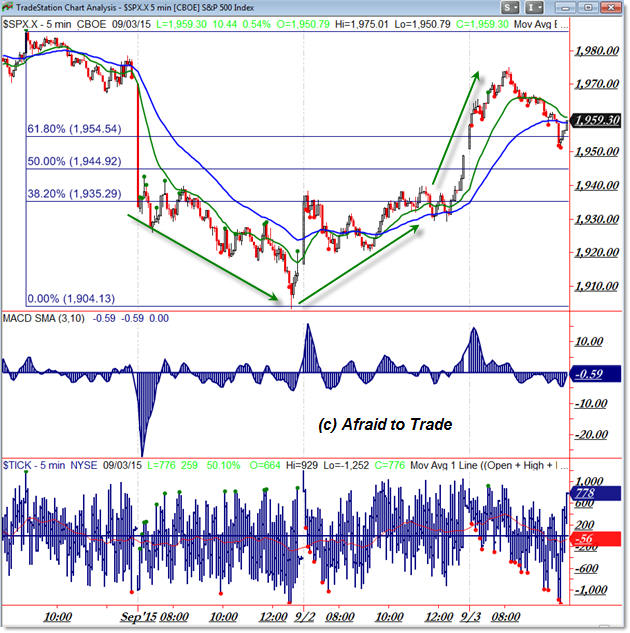
Again, start with yesterday’s mid-day planning update to see how I clearly plotted an upside likely pathway for price – and we see that move (and higher) today.
In-depth analysis is always provided to members of the Premium Daily Reports – I hope you’ll join and benefit.
A V-Spike Reversal late yesterday just above 1,900 set in motion the two-day (so far) rally higher above the Fibonacci Grid.
Priced traded all the way back to fill the downside gap near 1,970 from August 31.
At this point, we see negative divergences into today’s highs and a focus on the 1,960 and 1,945 levels here.
Receive daily updates, planning, and education by joining fellow members of the Afraid to Trade Premium Membership (before subscription prices rise).
Let’s see what our Breadth Chart reveals about current market strength (or weakness):
Here’s another quote from yesterday’s mid-day update:
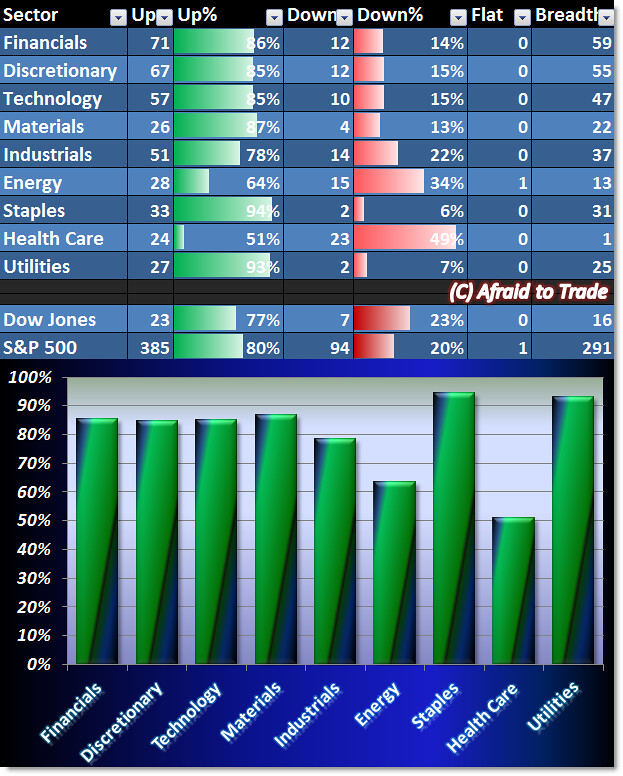
One argument for bullish prices yet to come is from today’s Sector Breadth Chart.
With broad participation, it suggests strong bullish money flow and the potential … for additional bullish movement.
We’re still seeing across the board bullishness with all but three sectors above the 80% line.
Our weakest performer today is Health Care, followed by Energy.
The huge, strong bullish performance in defensive Staples and Utilities should give us caution, so we’ll be less bullish than we were yesterday.
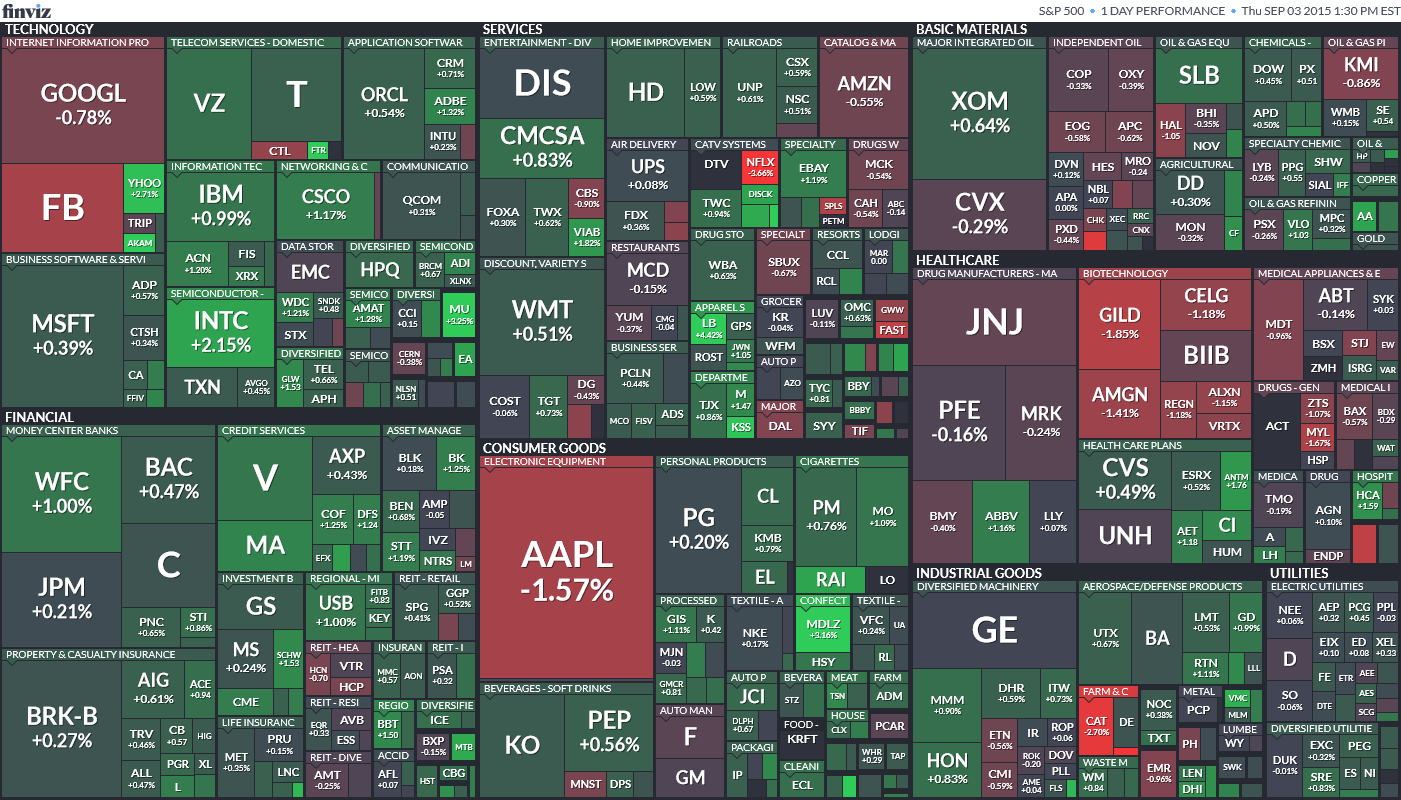
Here’s a top-level or full-perspective view of today’s S&P 500 stock performance (courtesy of FinViz.com).
Here are today’s strongest trending (intraday) names – candidates for pro-trend continuation:
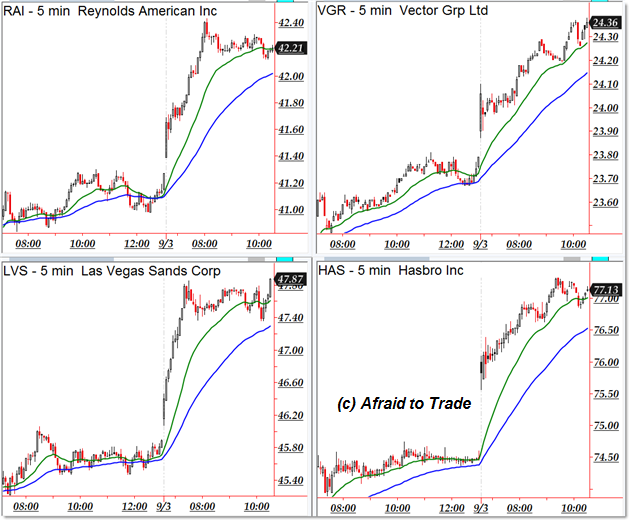
Reynolds American (RAI), Vector Group (VGR), Las Vegas Sands (LVS), and Hasbro (HAS)
Bearish downtrending candidates include the following stocks from our “weakness” scan:
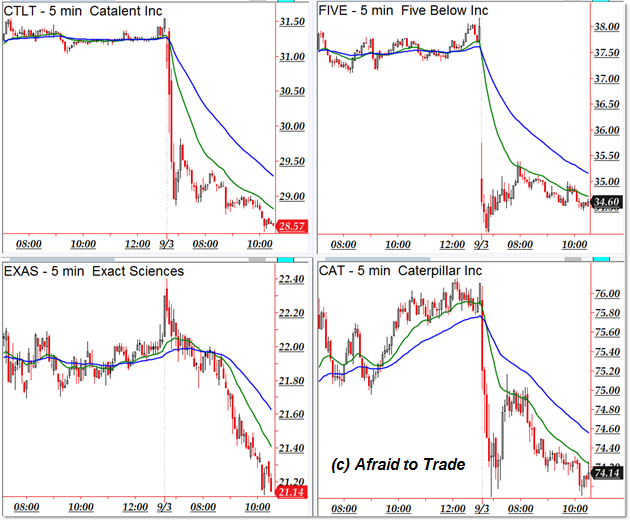
Catalent (CTLT), Five Below (FIVE), Exact Sciences (EXAS), and Caterpillar (CAT)
Follow along with members of the Afraid to Trade Premium Membership for real-time updates and additional trade planning.
Follow along with members of the Afraid to Trade Premium Membership for real-time updates and additional trade planning.
Corey Rosenbloom, CMT
Afraid to Trade.com
Follow Corey on Twitter: http://twitter.com/afraidtotrade
Corey’s book The Complete Trading Course (Wiley Finance) is now available along with the newly released Profiting from the Life Cycle of a Stock Trend presentation (also from Wiley).


It is important to work with the key levels if we want to succeed, it can be huge trouble if we go otherwise. I am trading with OctaFX broker where thy have got latest cTrader platform, it’s especially develop for ECN trading while there is upgraded features and facilities available, so that helps me work out these things much better and that allows me to be successful easily while this is certainly not possible with normal platform like Mt4 or any other.