SP500 Struggles to Hold Breakout Trendline
With today’s sell-off in motion, let’s step our perspective up to the higher frame and note the dominant trendline in play. What happens here could easily determine our game-plan for swing trading and over multiple intraday “day” trading sessions in the market.
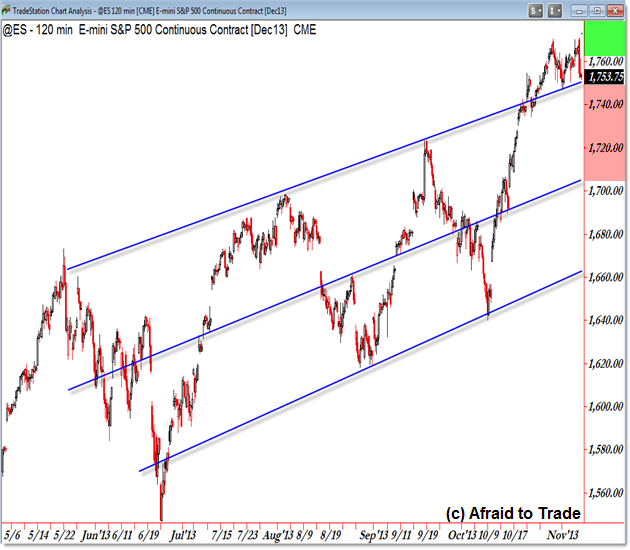
We’ll start with a “pure price and trendline” view of the @ES Futures:

The 120 min intraday chart clearly shows the “Rising Range” or “Parallel Rising Trendline Channel” pattern currently in motion for the @ES and S&P 500.
The initial breakout on October 22nd set in motion a “popped stops” or “short-squeeze fueled” upside rally which found resistance into the 1,770 price area.
From there, price “rode” or reversed intraday up off this rising trendline target area each of the two previous touches of the line.
The question now is whether short-term history will repeat and buyers will again step in to defend the trendline (bullish bias if so), or whether buyers have exhausted themselves and sellers will dominant the short-term supply/demand picture.
We would favor sellers/bears on a return under the rising trendline. It opens up a swing or intraday strategy short toward the Midpoint of the trendline into 1,710 if not a full play back to challenge the lower rising trendline intersecting 1,665.
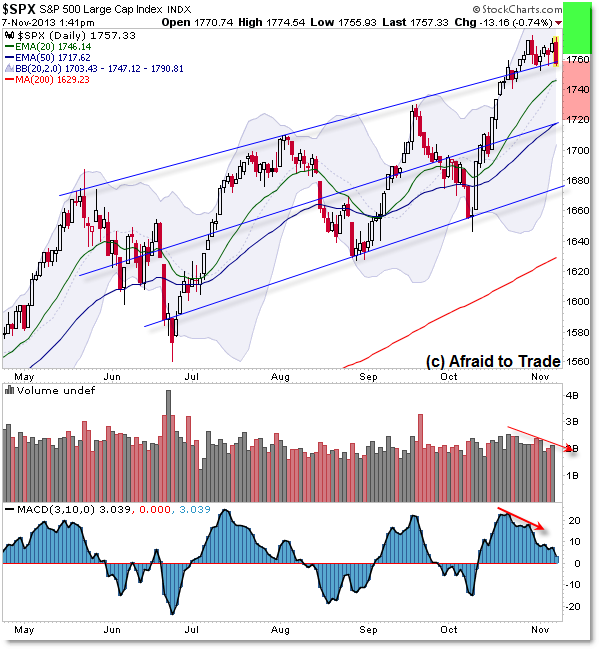
To help with “planning the future,” let’s turn to a few more indicators on the Daily Chart:

Again, we see the S&P 500 index “riding” the upper trendline as a support shelf since its late October breakout.
Volume and momentum have declined, which tip the odds to expect a downward resolution from here. However, we need confirmation from price which would come in the form of additional downside pressure which cleanly breaks the rising trendline currently intersecting the 1,760 level.
Should we see a logical breakdown here, we’ll look initially to play toward the first support confluence into 1,720 (rising 50 day EMA and Midpoint Trendline).
Follow along with members of the Daily Commentary and Idealized Trades summaries for real-time updates and additional trade planning parameters as we watch a “hold and bounce” or “break and retrace” scenario play out in the near future.
Corey Rosenbloom, CMT
Afraid to Trade.com
Follow Corey on Twitter: http://twitter.com/afraidtotrade
Corey’s new book The Complete Trading Course (Wiley Finance) is now available along with the newly released Profiting from the Life Cycle of a Stock Trend presentation (also from Wiley).

Oct WPI inflation data to be released on November 14. http://www.moneycontroltips.co…