SP500 View with Elliott Projection to Start the Week
Tuesday’s off to a horrific start for the bulls as the indexes are down over 3% mid-day. Let’s see this in the broader context of the S&P 500’s Daily Chart and overlay a possible Elliott Wave Count complete with terminal projection and proposed pathway.
S&P 500:
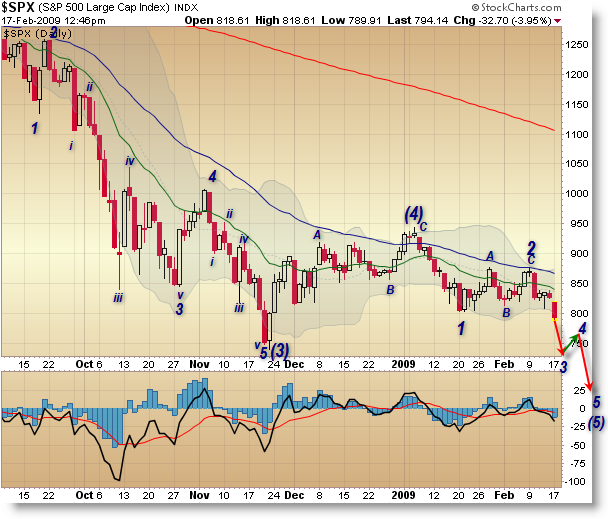
This is my preferred count for the moment, which has us currently in fractal 3 of the final (5)th Wave to finish off – for the time being – this downside slide in the market. I’ve mentioned before that we were possibly in the 3rd Wave but we got one more swing-up in February to challenge the declining 50 day EMA, but it looks like the strong downward momentum on Tuesday morning helps confirm that we are in the middle of a powerful move down which is most likely indicative of some sort of 3rd Wave – perhaps as drawn above.
The Elliott count is not drawn to scale and I am not making a price projection on this chart – only showing the potential form the price action could take if this count is correct.
Laying aside the Elliott Count, we have the following analysis:
Price is beneath all three key moving averages, and these averages are in the most bearish orientation possible.
The 3/10 Momentum Oscillator is signaling a price/momentum compression (as is the price itself), hinting that an expansion move up or down (down, most likely now) is yet to come (could be occurring currently). It has yet to make a new momentum low but after today’s close is taken into account, it’s likely we’ll get that NML very soon.
Finally, there is absolutely no technical support underneath the market (now that we’ve broken 800) until we get down to the 741 price, which was the November lows in 2008. The market is most likely going to test this level like a “Magnet Trade” now that support has been broken (assuming that we CLOSE beneath 800 at the end of today’s session). At that point (once price reaches 741), there will likely be a battle for control (bulls/bears) but we’ll need to reassess once that level is tested… with the bears more likely than bulls to prevail.
This is quick, mid-day (lunchtime) analysis so we’ll need to re-address this after the close. This is just a heads-up quick update.
Dr. Brett Steenbarger of TraderFeed updated us this weekend on his “Sector Update” Post, in which he also hinted we are quite likely to challenge the 741 November low soon.
Corey Rosenbloom
Afraid to Trade.com
Register for free here to keep up with the Afraid to Trade.com blog.
Hello Corey. In order to qualify as a new momentum low on this timeframe would the new momentum low have to go lower than the october 12th low on the 3/10?
Just as NotAfraidofTrend commented in the next post … I’m hoping for a near term bullish case that the next move is up, as 4C and that 4 hasn’t yet completed. Would that only be valid if the lows were NOT taken out?