Stepping Inside the Recent Goldman Sachs GS Price Breakout Trade
Similar to that of RIMM, Goldman Sachs (GS) stock broke a critical resistance level which set-up a great breakout trading opportunity for those poised to take advantage of it.
Let’s learn the lesson from this breakout, discuss another example of the “Popped Stops” and “Open Air” concepts, and be ready to apply this lesson in the next stock where it happens.
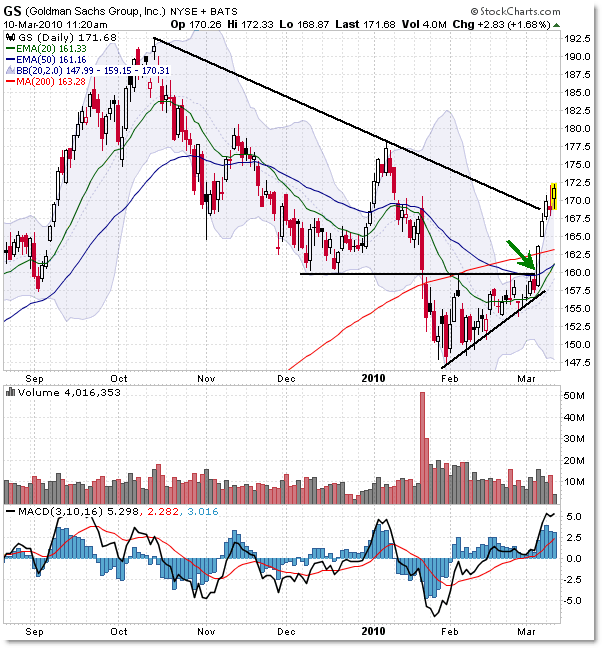
First, let’s set-up the scenario on the Daily Chart:

We see the aftermath of the breakout, but let’s step back and visualize the calculus as price tested the underside of the confluence resistance level of $160.00 per share.
Reference the previous lesson I wrote from the “Open Air Pockets Lesson in RIMM” for more insights into an almost identical situation, only RIMM used Fibonacci resistance levels instead of moving averages.
The main idea is that traders will short-sell a move into a confluence resistance area and then place stops on the opposite side of the level – in this case – above $160. Perhaps they were playing for a target of the prior lows of $145 or lower.
However, those aware of the “Open Air” and “Popped Stops” concepts were able to see supply and demand more clearly and utilize “IF/THEN” logic to capitalize on an unexpected break above key resistance.
Once price breaks above the resistance level, triggering the stop-losses of the short-sellers and also triggering new “breakout” buy (long) orders of the buyers, then a “Positive Feedback Loop” or “Open Air Pocket” occurs which gives intraday and swing traders a distinct edge to play in this “air pocket” breakout price move.
For reference, the $160 level was a convergence of a prior price support level (black line) and the 50 day EMA (along with being “round number” resistance).
The IF/THEN statement would go like this:
“The expectation is that GS will hold resistance and swing lower, but if buyers push price into the ‘pocket’ of stops, THEN we could see a quick positive feedback loop develop that thrusts prices higher in a tradeable set-up”.
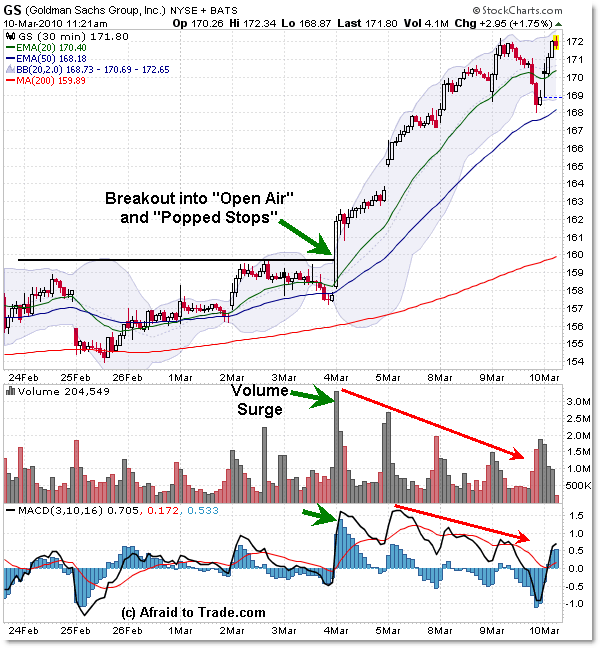
And that’s exactly what happened:

Price busted above $160 then $161 then $162 on a surge, creating immediately a new volume and momentum high along with a “go long” signal to play the breakout for those intraday traders who were bold enough to tackle this breakout set-up – a bust above key resistance.
The chart above is one of the best examples of the “Positive Feedback Loop” of how price ‘sliced’ through the Air Pocket above a key resistance area.
By “Positive Feedback Loop,” I mean that buyers are buying, driving prices higher which triggers more stop-losses of the sellers, which also drives prices higher, as momentum traders jump on board, buying – pushing price higher, triggering more stop-losses from the sellers, and so on.
Even if you don’t take advantage of these situations – it is an aggressive/bold move – then at the minimum, you should NEVER try to fade or short-sell a market caught in a positive feedback loop.
There’s no way to know how far a market will rally while in this breakout/momentum mode, so the safest play is to trade in the direction of the breakout until you see crystal clear indications – such as trendline breaks or lower timeframe EMA breaks – that the momentum is slowing (seen by a negative divergence) and price could reverse.
Even still, price continued rallying higher despite a negative volume and momentum divergence, which underscores the power of this ‘breakout’ mode.
Take some time to study these concepts in more detail to add them to your trading arsenal.
For related posts, see the following:
Open Air Pockets Lesson in RIMM
“1,100 Resistance Level to Hold or Break,”
“Lessons From Failed Signals and Popped Stops”
“What Happens when Resistance is Broken?”
“Opportunities from Popped Stops Intraday”
Corey Rosenbloom, CMT
Afraid to Trade.com
Follow Corey on Twitter: http://twitter.com/afraidtotrade

I don't know why but I'm terrible when it comes to breakouts so I tend to avoid them altogether. It doesn't matter what the vehicle or timeframe is – they always turn around on me.
Here's an example I remember… Look at the 2 year chart of CHK.
http://stockcharts.com/h-sc/ui?s=CHK&p=D&yr=2&m…
There was resistance at $25 going back to the fall of 2008 and look at the heavy volume on the September 2009 breakout. But the breakout failed.
I should have traded the inv H&S bottom on APA because the breakout above $87 was good. :/