Stepping Inside the SP500 Rally into 1220 Resistance
What are chart traders watching as we start the week of September 19th?
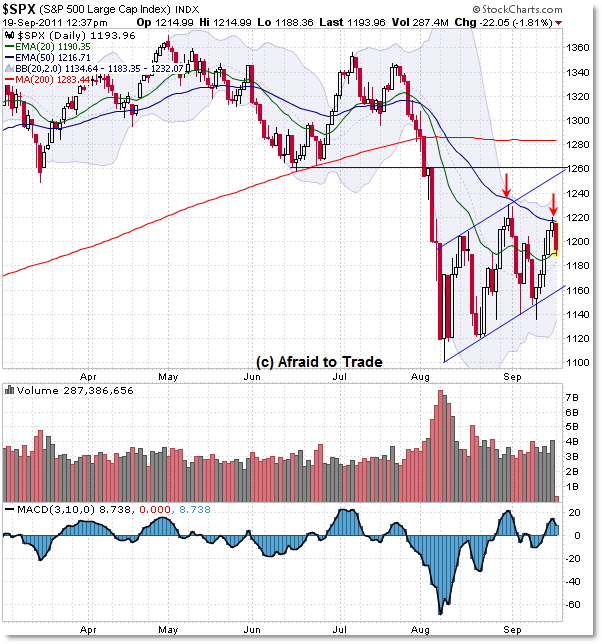
Let’s take a quick look at the key overhead resistance level on the Daily S&P 500 chart and step inside the market with a view of intraday Market Internals:

Focusing on the most important point: Price has rallied into the overhead resistance of the falling 50 Day Exponential Moving Average (EMA) which recent served as a short-term turning/inflection point as September began.
The simple expectation would be to assume ANOTHER down-swing/inflection would begin here at 1,220.
However, if we play the possibilities out further, we see that another upper resistance cluster exists initially at 1,235 (the prior ‘spike’ swing high) though the major overhead “Make or Break” level to watch is the price, Fibonacci (not shown), and Trendline cluster at 1,260.
Any movement up above 1,220 is likely to cause some of the bears/short-sellers to stop-out, which would create a short-squeeze that could take price as high as the 1,260 cluster, at which time a major bull/bear battle would occur into resistance – bears lose above 1,260.
On a continued downswing that breaks beneath today’s session low (the 20d EMA), look for a minimum play to the rising trendline support at 1,160 or the ‘spike’ intraday price lows at 1,140.
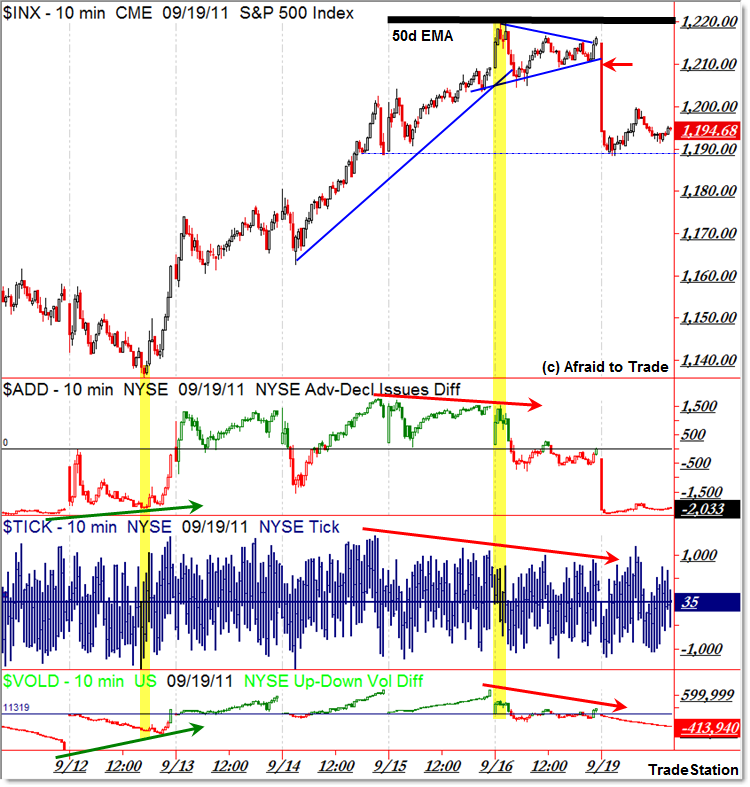
To get a clearer picture of where the market stands currently, let’s “step inside” by viewing intraday Market Internals:

I posted a prior update on S&P 500 Market Internals on September 13th, which highlighted the positive divergences that led to last week’s expected upper-swing into the 1,220 region.
Market internals – as you can see slightly above – gave a bullish positive divergence on September 12th which was confirmed later by price (breaking falling trendlines).
However, the picture is different now, with all three “Big Market Internals” showing clean negative divergences intraday as price scrapes against the underside of the falling 50 day EMA (and upper Bollinger Band).
The morning gap gave us an initial ‘sell’ signal, though we’d need to see price ‘cooperate’ further with a firm breakdown under the newly-created minor support level at 1,190 (which is the 20d EMA as well as a small price shelf as seen above).
So here’s the bottom line – any further movement under 1,190 confirms the negative divergence and short-term reversal signal in effect (as seen on the Daily Chart) and allows you to play for lower support targets (1,160 then 1,140).
Any major rally off the 1,190 support calls into question the bearish signals, and invalidates them officially above 1,220 (which could set-up a major short-squeeze rally as bears capitulate).
Use these levels to develop your unbiased short-term expectations and game-plans.
Corey Rosenbloom, CMT
Afraid to Trade.com
Follow Corey on Twitter: http://twitter.com/afraidtotrade
Corey’s new book The Complete Trading Course (Wiley Finance) is now available!
