Stepping Inside the Straight Up Rally for the SP500
What does the chart suggest about the current rally into 2,000 and what can we see by “stepping inside” the market right now?
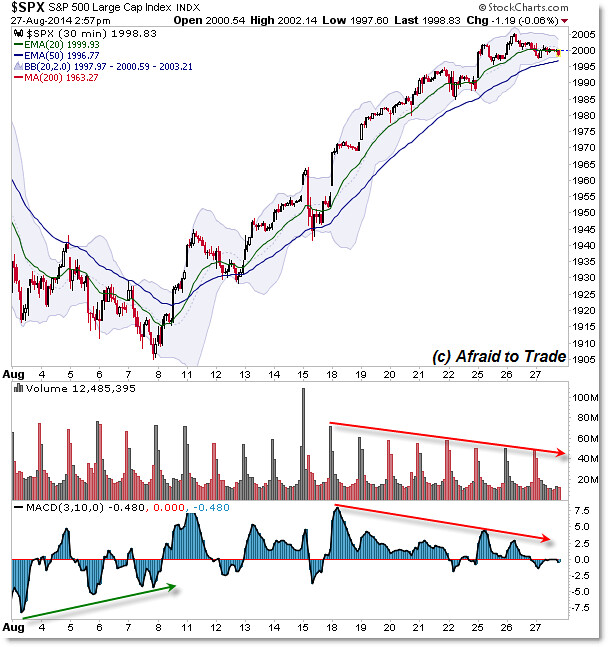
Let’s take a quick look at the S&P 500 and focus on key levels:

Let’s focus on the strong impulsively rally up from 1,900 to 2,000 (we’ll start simply).
Price achieved the full 2,000 index target and now is forming doji/reversal candles into the upper Bollinger Band (and 2,000 target).
This alone suggests odds favor a retracement down as opposed to yet another short-squeezed breakout higher.
WE then add the Volume Divergence along with the momentum divergence as seen best on the hourly chart:

The Momentum oscillator – along with volume – peaked mid-August which suggested price was likely to continue trading higher.
Price did fully achieve the simple 2,000 target but this time with divergences across the board.
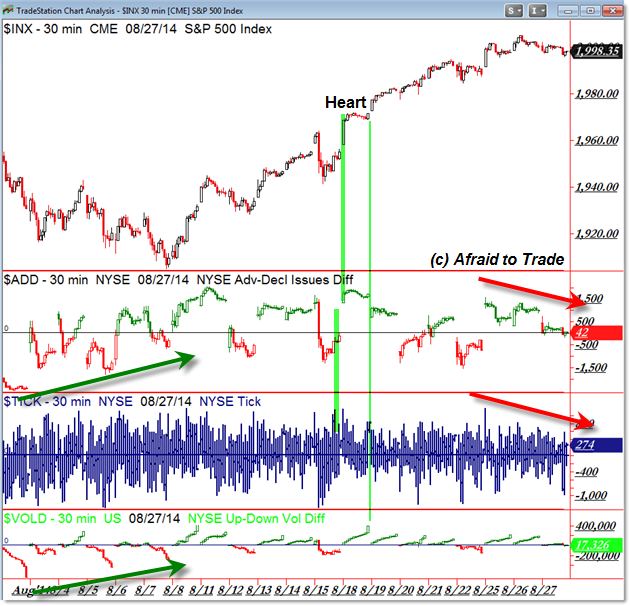
We’re even seeing divergences with key Market Internals:

Breadth, TICK, and Volume Difference (of Breadth) all are forming lower highs as price forms its all-time high.
I wanted to highlight the “heart” or core of the rally (middle) which was marked by spikes (confirmations) in Internals.
At this point, we’ll focus our attention on the 2,000 level and the Daily Chart where classical odds are rapidly shifting to the bearish/retracement case.
Of course, if buyers ignore the evidence and keep pushing prices higher, then more well-intentioned short-sellers will be forced to buy-back to cover losing positions, which perversely will push price higher despite any and all evidence to the contrary.
Corey Rosenbloom, CMT
Afraid to Trade.com
Follow Corey on Twitter: http://twitter.com/afraidtotrade
Corey’s book The Complete Trading Course (Wiley Finance) is now available along with the newly released Profiting from the Life Cycle of a Stock Trend presentation (also from Wiley).

One Comment
Comments are closed.