Surveying the Tuesday Selloff with Maps and Facts
After a major event in the market, I like to take the evening and assess what happened and what little bits of information stick out that other people might be missing.
Let’s take a look at some of those bits of information and market facts as the dust settles from Tuesday June 29th’s mini-crash.
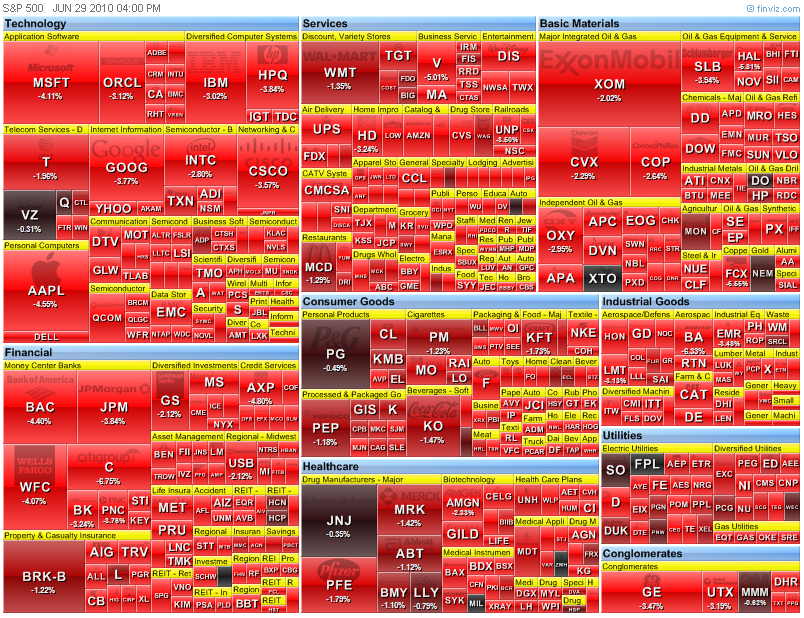
First, a look at the Heat-Map from FinViz:
Looking at the helpful FinViz Heatmap Tool, you’d guess that all stocks in the S&P 500 were down today … which is almost true.
Only One SP500 Stock was up as the day closed:
ZMH: Zimmer Holdings (0.05%)
The worst 5 performers of the day?
MU: Micron Tech (down 13%)
CLF: Cliff’s Natural Resources (down 11%)
TXT: Textron
AKS: AK Steel
TIE: Titanium Metals
Now let’s rise above the Stock Market and see the broader picture so far this week on the cross-markets:
Also from FinViz, we see the performance of asset classes so far this week.
The S&P 500 is down 3.3% along with the NASDAQ, though the Russell 2000 is down 4% so far.
The worst markets this week? Sugar, Natural Gas, Palladium and Copper.
Best? The safety assets of bonds.
I highlighted a breakout in bond prices on Monday – once again, just like the May 6th “Flash Crash,” the signal from bonds in the form of a breakout preceded (warned) of today’s crash.
This will teach traders to watch bond prices closer, perhaps.
Use days like this to study what happened across the markets and where the broken pieces lie after an event as strong as Tuesday’s stock market and crude oil sell-off.
Corey Rosenbloom, CMT
Afraid to Trade.com
Follow Corey on Twitter: http://twitter.com/afraidtotrade


Actually only ZMH was up today, and only 3 cents, the rest of the list is down
Good point, Jorge. I did a radarscreen scan from TradeStation in the evening that included after-hours trading data.
I've since corrected the post to reflect close of session data not including the after-hours.
The Heat Map and a look at commodities provides insight into wealth preservation and management.
I … Today's Yahoo Finace chart of GLD, SLV,USO, JJC, UNG, PALL, shows that gold and silver prove to be resilient investments, and actually introduces them as global currencies, with investment demand stemming from the wave of Debt Deflation that has struck the stock and commodities market.
Global Debt Deflation commenced on April 26, 2010 when the value shares failed to outperform the growth shares. It was at this time that the currency traders heavily sold the EUR/JPY, in response to the European Sovereign Debt Crisis, causing stocks to fall globally.
Debt deflation is consequence of credit expansion. One of the most famous quotations of Austrian economist Ludwig von Mises is that “There is no means of avoiding the final collapse of a boom brought about by credit expansion. The alternative is only whether the crisis should come sooner as the result of a voluntary abandonment of further credit expansion or later as a final and total catastrophe of the currency involved.”
Well getting back to today and the coverage of the commodities: USO, JJC, UNG, PALL. These are really pretty depressed investments; Palladium is even falling today.
II … The chart of various bonds, such as ZROZ, TLT, IEF, BVL, BIV, and GBF, shows that investors perceive these bonds to be a safe haven investment from the European sovereign debt crisis.
Risk aversion caused a sharp sell off in JNK and HYV in early May, 2010; but some investors have returned to obtain the high yields that HYV offers in spite of the fact that history shows carry trade disinvestment can cause a significant overnight loss of value.
The Yield Curve, $TYX:$TNX, has been increasing since the great unwinding of carry trade investment, as an end came to the Federal Reserve’s QE, and as the currency traders bought the Yen, FXY, to repay their 0.25% Bank of Japan carry trade loans, and sold currencies across the board, as seen in the Finviz Screener of FXA, FXE, FXM, FXC, ICN, FXB, FXS, SZR, FXF, CYB, BZF, XRU, FXB, FXY.
“But safe they ain’t”, as the great disinvestment of April 26, 2010, commenced debt deflation which caused a sell off in stocks. Deflation will come to bonds as interest rates rise on concerns that the US government will be unable to auction Treasuries because of tremendous deficit spending.
III. With regard to the The worst 5 performers of the day:
MU: Micron Tech (down 13%) — Semiconductors always make dramatic moves at or before market turns.
And as for the rest, these are basic material, IYM, and or industrial, XLI, stocks … IYM was off 4.1% and XLI was off 3.8%
CLF: Cliff’s Natural Resources (down 11%)
TXT: Textron
AKS: AK Steel
TIE: Titanium Metals
IV … The one week performance chart shows that the currency traders sold the Euro against the Yen: the 1.6% fall in the EUR/JPY set off a wave of disinvestment with the Russell 2000, IWM, falling more than the S&P, SPY, with the reason being the small caps stocks are more dependent upon a well functioning banking and lending infrastructure that has now been forever damaged from 1) a rising yield curve, 2) an expanding bond interest differential between corporate rates and government rates and 3) from contagion spreading from the European Sovereign Debt crisis.
The currency traders have also gone heavily short the Australian Dollar, FXA, relative to the Yen, FXY, this has caused roughly a ten percent fall in the financially laden and basic material laden Australian ETF, EWA.
Perhaps one might enjoy reading my chart article World Stocks Slide Over Euro Zone Debt Worries … The EUR/JPY Falls From 109.8 to 108 where I recommend short selling for institutional investors and gold investing for personal investors
http://theyenguy.wordpress.com/2010/06/29/world…