The 10 Year Treasury Note Triangle
The 10-Year Treasury Notes Price has been in a pullback retracement since 2009 began, but a clear triangle pattern has now formed and price is reaching the apex. Let’s look.
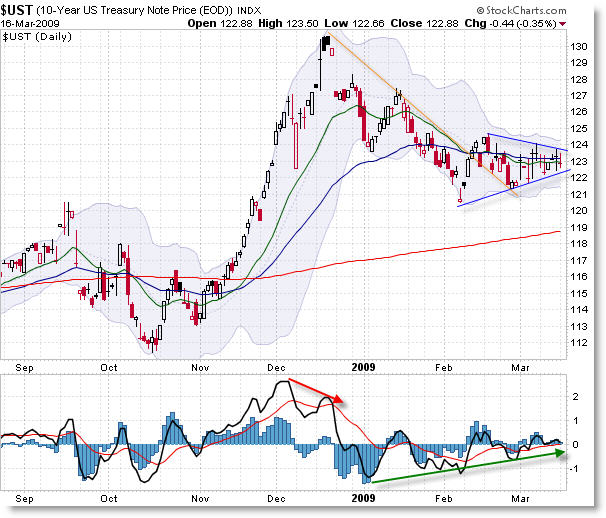
Price made a new high over $130 in late December, though we’ve seen a distinct retracement off this level ever since. Although I haven’t shown a Fibonacci grid, we’ve retraced back to the 50% retracement (from the lows to the highs) which stands at $121.05, an area where price is finding solid support (with the exception of one blip beneath).
Price broke a descending trendline in early February which led to the current consolidation – or triangle – pattern we’re seeing now.
A positive momentum divergence has been forming under price since we had our first swing low of the year in 2009, which could hint that the likely breakout will be to the upside… though it’s probably best to wait for an actual break to materialize before trying to guess in which direction price will break.
So we see support at $122 and resistance at $124 and a tightly coiled market between those levels. The moving averages are doing us no good (just like we throw out oscillators in a strong trend, we throw out moving averages in rangebound conditions).
Keep watching this closely. An upside break could mean we would get a downswing in US Equities (Stocks) which would complete the Elliott Wave (5) Theory. However, a break-down from this level could be construed as bullish for stocks. There’s other cross-currents (the Treasury issuing Bonds, which increases supply and pushes prices down) so classic analysis might not be so easy in this environment.
It’s a tightly coiled market – watch closely for the spring thrust out of this area.
Corey Rosenbloom
Afraid to Trade.com
Follow Corey on Twitter: http://twitter.com/afraidtotrade
Register (free) for the Afraid to Trade.com Blog to stay updated
Corey, favourable reaction to housing start figures, rightly or wrongly, my read is that this market wants to higher short term, EW 5 completion delayed.
Tresuries should fall in price, Govt needs to borrow more, so a breakdown should be expected, i am not sure if i would interpret that as bullish for Equities?
Jeremy,
You hit it – there’s so many cross-currents going on with Treasuries right now. It’s certainly not as easy as it used to be, with the Government issuing so many bonds which increases supply and drives down price. Then if the market does fall (soon), we could have a situation where both Stocks and Bonds fall simultaneously.
Generally we’d expect investors to flock from one or the other, but the “Money Printing Press” is throwing a wrench in cross-market analysis.
Still, we want to keep our eye on the 800 level in the S&P (not to go above) and the $122 level in 10Y Note Index (not to go below).
Not saying these will hold, but these are the common expectations and potentially significant price areas to watch.
The answer is TBT.
Corey, do you still maintain that we are in the zone for a down leg on SPX and other indeces? The INO analysis of last Friday shows we are almost there.
Sorry I meant the Adam Hewison’s video on whether we’re having a “Bear Market Rally… or Serious Reversal.” that you posted below.
TBT (inverse 20y Treasuries) looks mighty bullish right here. It’s still in a consolidation but at the upper range. A break above would lead to a good push up (which would mean the 10Y Index I have shown here would break down, along with TLT).
I still believe a final downswing needs to form to complete the structure, however I would officially negate that view if we broke strongly above 800 on the S&P. I believe 800 (if not here at 775) holds strong resistance and until proven otherwise with a break above, I still treat this as a counter-rally swing into EMA resistance.
Also look at $TNX it is entering the sweet spot of the triangle, it could break out or down. But I agree there are lot of cross currents going on and its hard to read the charts with the govt selling bonds
Anon,
Though we think we can predict the expansion direction out of a triangle, we can’t. No matter what the prior trend was.
A consolidation means prices have come into balance. It doesn’t take much to tip them out of balance to cause an expansion move, and we’re never guaranteed to know in which direction the imbalance will take prices.