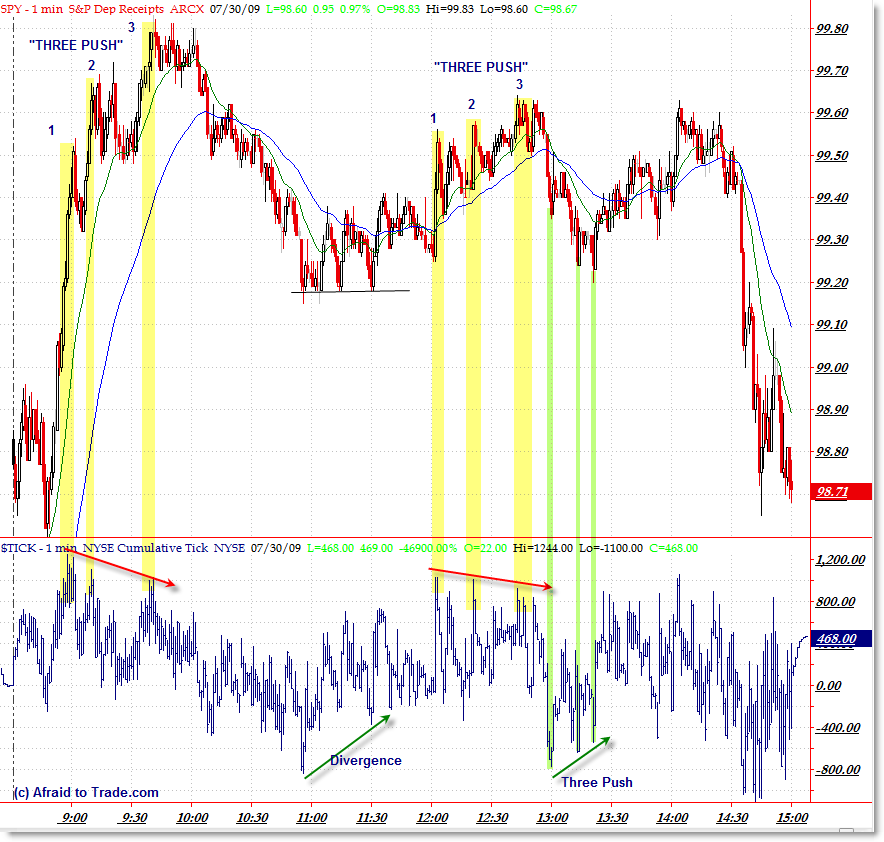
The 3 Three Push TICK Examples of July 30
I’ve never (or can’t remember) seeing three “Three Push” TICK Divergences on the same day, but July 30th’s intraday SPY (and @ES) charts gave us this repetitive and high probability reversal pattern. Let’s take a quick look at it!
The day began with an opening gap that pushed into the first “Three Push” reversal pattern, in which three symmetrical ‘swings’ to new highs formed on lower high TICK readings – thus creating the divergence.
Price did reverse off these levels and later formed a “flat-line” divergence going into 11:30 am CST.
We were treated with an almost identical “Three Push” TICK Divergence with price at 12:30 pm CST as we saw the same ‘three pushes up’ in price that formed lower TICK highs on each swing.
Finally, we had a positive “Three Push” divergence going into 1:30 which resulted in a relatively short-lived swing to the upside.
You can learn more about the “Three Push” pattern at our free Education Page which will be a continually expanding resource for you.
For a full description of this chart and for an explanation of the trading strategies of the day, including how to monitor price to determine the type of day that forms (I would consider this a “Fang Day” if there was such a term! Technically it was a Failed Trend Day up / Rounded Reversal), please subscribe to our new “Idealized Trades” daily summary service (more information here).
It’s unusual to have a three-push in the TICK but more common in the 3/10 or other momentum oscillators – it’s good to learn about this pattern because if offers great edge and repeats with decent frequency to offer plenty of opportunities for you.
Corey Rosenbloom, CMT


great post, I'm following the $tick much closer these days.
great post, I'm following the $tick much closer these days.