The Arc Pattern and Support Test in Gold
Gold prices always keep investors on a bumpy ride, though the ride has at some points been straight up.
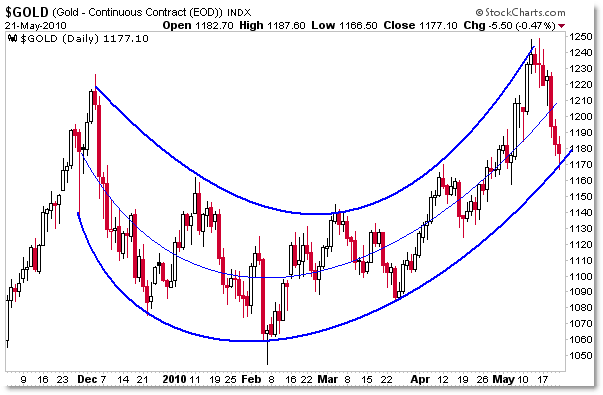
Let’s take a quick look at the interesting arc pattern – curved trendlines basically – that gold prices are forming and where we stand within that pattern.
First, the “Pure Arc” price chart:

Trendlines don’t always have to be linear – they can be curved, angular, or arcs like we’re seeing currently in gold.
The pattern officially completed a “Mirror Image Foldback” structure where the right side of the chart looks eerily similar to the left side.
The upper trendline curves up to the recent resistance at the $1,250 level while the lower trendline arc – which is much more pertinent for this discussion – rests at the key $1,170 expected support zone.
Let’s see what else is important about $1,170.
Next, let’s throw a few standard indicators on the chart:

We still see the arc, but more importantly, we see the 50 day EMA rest at $1,166 which is where price found a bottom (low) today and formed a hammer-style candle.
The short term play is to expect a bounce off this level – the convergence of the EMA and Arc, but in the event that sellers keep taking profits in gold, we can expect further selling under $1,165 which would break out of the arc and under the support of the 50 day EMA.
I’ll talk more about this – along with oil, bonds, stocks, and the US Dollar – as usual in this weekend’s Inter-Market Report for members.
See sample reports and more information at the information page to see if you would benefit from the analysis in the reports.
Corey Rosenbloom, CMT
Afraid to Trade.com
Follow Corey on Twitter: http://twitter.com/afraidtotrade

Thanks… i trade gold
I'd like to see other “arc” patterns for this product. Different time frames, different arcs………but, that may show conflicting signals……
It is really important to see this graph. Thanks!
i have seen lots of these arc toward last 20 minutes of trading days…computerized perhaps?
A cup is forming in the price of gold as can be seen in your chart of gold; soon will come the handle with an explosive upward trajectory in price; Investopedia provides the details on the cup and handle trading pattern … http://www.investopedia.com/terms/c/cupandhandl…
Markets are driven by either fear or greed.
Fears have risen over sovereign debt globally, while they have subsided some with the EU Finance Leaders and State Leaders meeting at the Euro Stability and Growth Pact Task Force, currency traders and credit default swap traders will destabilize equity and debt markets globally, and investors will rush into gold driving its price dramatically higher.
Is this curve charting similar to what one gold guy Jim Sinclair uses called French Curves ?