The Bullish Turn and Range Action in Gold Nov 7
We posted about a Bullish Surge in Crude Oil this morning, and we’ll now combine that with a bullish reversal into a rising range environment for Gold.
What does that mean and what’s the planning levels right now?
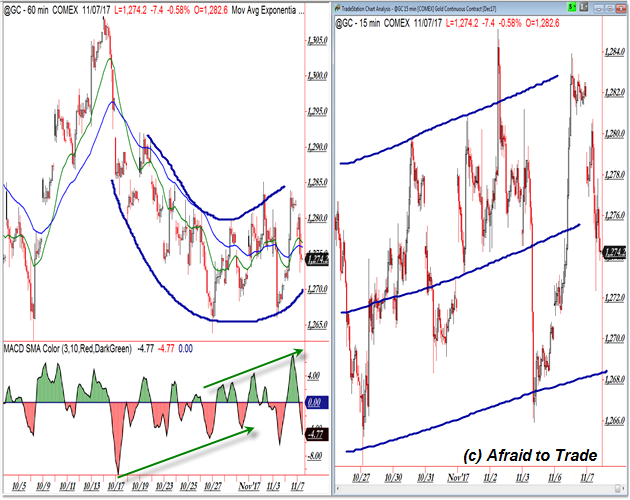
Let’s start with the hourly (intraday) chart on the left.
We have Gold (@GC) falling from a resistance high – on negative divergences – from the $1,305 level.
A downtrend took price toward the active support target near $1,265 on positive divergences.
I drew an “Arc Trendline” pattern to connect the swing lows and highs – note the reversal higher.
Now, on the right chart, we see the 15-min chart forming a Rising Range pattern with volatile gap-action throwing price from range high to range low.
Frame your trades in terms of the movement between these rising trendlines and use them as stop and entry parameters on your chart.
Stay tuned as we continue to give you more daily updates and market commentaries!

Follow along with members of the Afraid to Trade Premium Membership for real-time updates and additional trade planning.
Corey Rosenbloom, CMT
Follow Corey on Twitter: http://twitter.com/afraidtotrade
Corey’s book The Complete Trading Course (Wiley Finance) is now available along with the newly released Profiting from the Life Cycle of a Stock Trend presentation (also from Wiley).”