The Current SP500 SPY Symmetrical Triangle Pattern
It makes sense that the broader market would pause to catch its breath after such a stellar October performance.
That’s what’s happening at the moment as the S&P 500 consolidates/pauses in a sideways/symmetrical triangle price pattern.
Let’s review the pattern and the current trendline reference areas and develop a game-plan of what to do with a future breakout.
First, the pure S&P 500 Triangle Pattern:

We’ll add more indicators to the mix later, though it’s often helpful to start any form of chart-analysis with a “pure price” chart free from clutter.
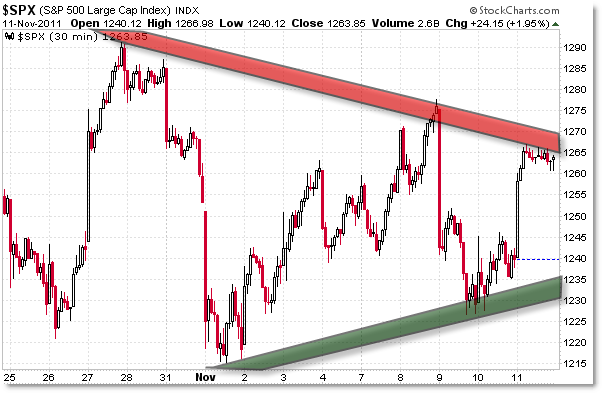
In this case, we see the 30-min intraday S&P 500 chart with short-term compressing (converging) trendlines that form a Symmetrical Triangle Price Pattern.
The current Red Upper Resistance Line comes in around 1,265/1,270 while the rising Green Support Line trades around 1,230/1,235.
That makes the “Midpoint” level 1,250 (the Center of the developing pattern).
The simple play would be to trade short-term within the boundaries of this pattern intraday and then prepare to trade the initial breakout – a down-break quickly targets 1,215/1,220 while an up-break targets 1,290.
Triangle Patterns tend to produce breakout/impulse moves that travel beyond the initial targets of the prior imediate swing highs and lows, and for that, we’ll need to turn to the higher frames.
But first, let’s take a look at the SPY ETF and throw volume insights into the mix:

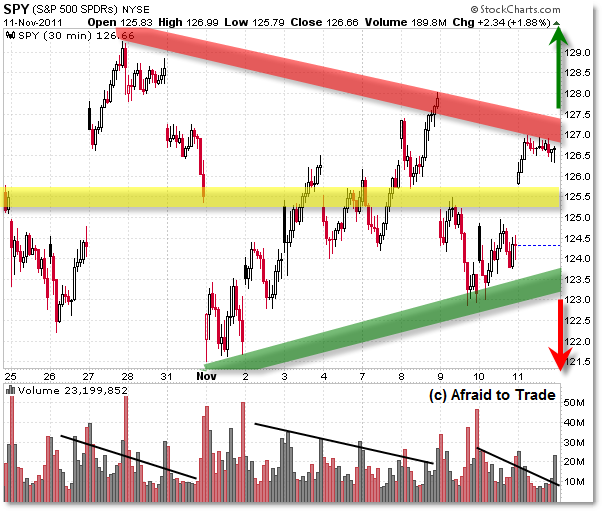
I added a yellow horizontal “Fair Value” or “Midpoint Value Area” mark at $125.50 which is roughly the 1,250 area in the S&P 500. Otherwise, the breakout area is $127 and $123/$123.50 respectively.
Volume has a tendency to decline in the context of a consolidation pattern and that’s what we’re seeing at the moment.
Specifically, we’re seeing a form of distribution volume wherein volume steadily declines as price rises higher and then increases as price declines.
Distributive Volume suggests a downside resolution, but we merely need to look back to October’s non-stop rally to see how price defied the odds and continued its upward march to where we are now.
With the levels and volume insights above us, let’s now jump to the Daily Chart for more chart-facts:

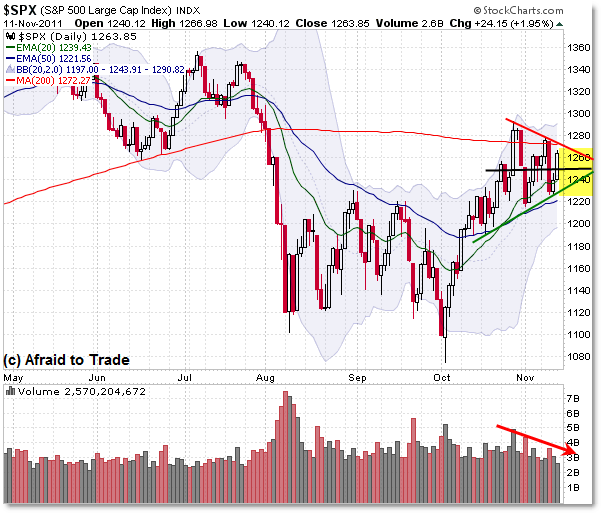
The Daily Chart not only puts the current Symmetrical Triangle in context, but it also gives us extra reference levels that help us understand WHY price is consolidating at the moment.
Above price is the confluence resistance from 1,275 (200d SMA) and 1,295 (a price polarity level and October swing high).
To over-simplify, you can refer to 1,300 as the key major resistance level that – if broken – should lead to a “Popped Stops” breakaway move higher towards 1,350/1,375.
On the downside, we have rising support from a longer green support trendline as drawn as well as the rising 20 and 50 day EMAs (1,240 and 1,220 respectively).
Just as you can oversimplify 1,300 on the upside, we can oversimplify 1,220 or even 1,200 as the critical downside support confluence which – if broken – should produce an impulse breakdown back towards 1,120/1,100.
We can also see that Volume is suggestive of a downside break, but we make money trading PRICE (what actually happens) as opposed to indicators (which clue us in to what is SUPPOSED to happen).
Keep these dominant short-term reference levels in view as we trade the week(s) ahead.
Corey Rosenbloom, CMT
Afraid to Trade.com
Follow Corey on Twitter: http://twitter.com/afraidtotrade
Corey’s new book The Complete Trading Course (Wiley Finance) is now available!

Excellent, as always. Thanks.
Two things worry me about this triangle. First, everyone is talking about it. Patterns that everyone recognize tend to not pan out as expected. Second is the news flow out of Europe. I think the dips have been bought, which leads to the bullish pattern development but if the news flow continues to hammer on the markets it can potentially wear out the buyers.
Watching the dollar can help and it appears to send a bullish message as I wrote here today (http://srsfinance.com/articles… ) but things can still go either way here as you suggest, or, a third option, the triangle can just turn into a rectangle and continue to frustrate.
i think the S&P 1000 is coming