The XOM Triangle Lesson on Trendlines Aug 10
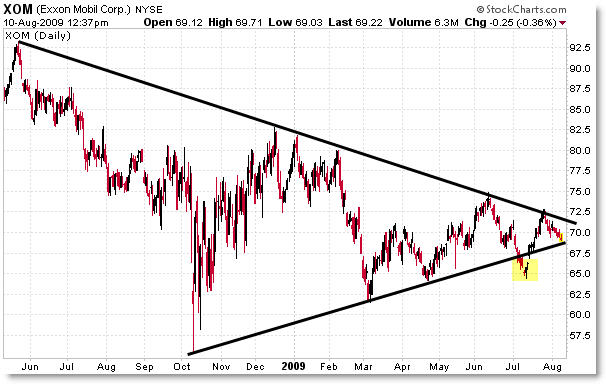
Exxon-Mobile (XOM) is forming a large-scale contracting (symmetrical) triangle pattern on the daily and weekly chart that you might want to examine further. Let’s take a quick look:

Beginning with the late 2008 December highs of $82, a clear downward trendline can be drawn that (almost) perfectly connects the next four price highs, making the trendline confirmed at 5 price points – quite valid.
The lower line begins off the March lows (technically, you could have begun this line off the October 2007 price lows of $57) and is open to two interpretations:
Looking at this chart, the first thinner line connects the April lows and terminates just above $68. This would count the July lows as a “False Break-down” (or ‘head-fake’). This would suggest that price is likely to find possible support at $68… or upon a breakdown of $68, price would test the $65 lower trendline level.
The second (thicker) line connects the July lows to the March lows and terminates just above $55. I’m less likely to ‘believe’ this trendline due to the following chart which gives us a broader perspective.

The trendline that ends at the $68.00 level is clearly more valid than the one that ends at the $65 level because it is “touched” four times beginning with the October lows.
This perspective pulls back beyond the 2009 highs to connect the May 2008 highs which further confirms this trendline.
This post – as well as my Educational Page on Trendlines – serves as an example of how to draw trendlines and capture the larger perspective.
Trendlines are MORE valid if:
- They last longer than shorter-term trendlines
- Are touched more times (price points)
- Have angles that are not ‘extreme’ (aka vertical)
Knowing this can clue us in that the July lows were a FALSE break which gives us a bit more perspective that would be missed if you drew a trendline specifically to connect that point. Think of the emotion and positions of people who saw a long-term trendline violated and short-sold here… only to have price rally up on them perhaps triggering their stops. That’s useful information to know.
The play on XOM should be to expect a price breakout – one way or the other – from this long-term consolidation pattern and play the break of the upper or lower trendline for a large target play… with a stop on the opposite side of the triangle.
If anything, it gives us a chance to see this principle played out in real time on a major US Stock.
Corey Rosenbloom, CMT
Follow Corey on Twitter: http://twitter.com/afraidtotrade

2 Comments
Comments are closed.