Three Steps to a Trade a Collapse Lesson from Dryships DRYS and Qualcomm QCOM
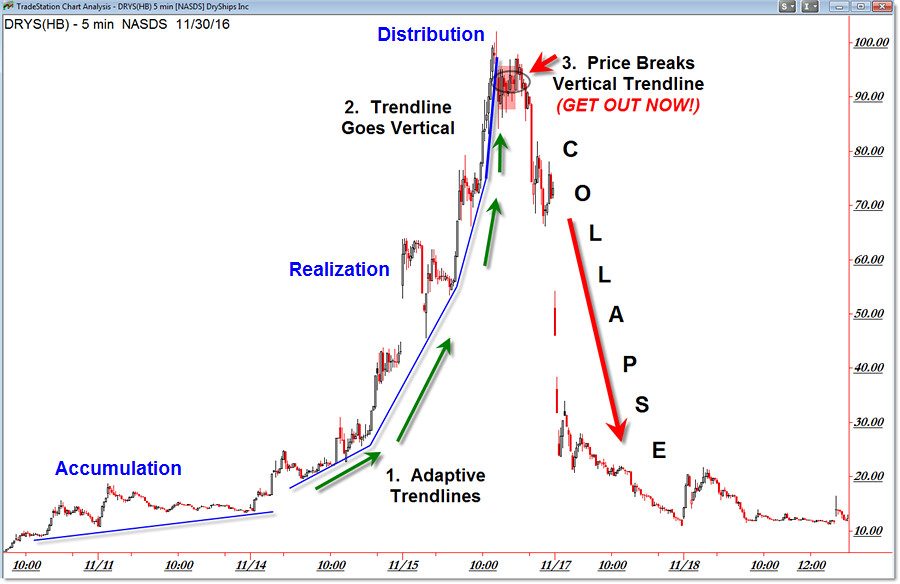
I’m still surprised with how quickly Dryships (DRYS) surged from $5.00 to $100.00 but even more impressed with the even faster speed it collapsed from $100.00 back to $5.00.
Dryships (DRYS) serves as a perfect example of a euphoria pattern shows up on a stock’s chart when fear/greed (in this case extreme versions of both) capture trader’s interest.
It’s a common pattern and one you should learn as soon as possible – and here’s a great simple example of the pattern.

We’re seeing the entire birth-to-death cycle on the 5-min intraday chart – though the pattern works on any timeframe.
Let’s start with the black labels (1, 2, 3).
We have price emerge to life and captivate savvy traders early as a new uptrend emerges.
As buying pressure escalates, we see the first phase which appears as 1. ADAPTIVE TRENDLINES.
This just means we re-draw trendlines as momentum and price slope higher.
Continue adapting/re-drawing your trendlines – and of course buying retracements – until you see price go vertical.
When price goes vertical, this is phase 2 (VERTICAL TRENDLINES).
Ironically this is the point where buyers are most euphoric/enthusiastic but it’s also the most dangerous phase.
It’s very difficult to short-sell into a rapidly rising market even if you “know” it’s about to collapse.
That’s where phase 3 enters, and it’s the VERTICAL TRENDLINE BREAK.
At this phase, price moves SIDEWAYS to break through the vertical trendline and it’s at this point that you must stop buying (if you’re still doing that).
While it’s still very risky – as price can lurch higher – short-sellers can put on initial positions here.
If the cycle continues, the next phase is indeed the collapse where fear instantly replaces greed.
It’s difficult to enter a collapsing market, even here as shown on the 5-min timeframe.
The main idea is that you study internalize this pattern which repeats when euphoria takes over.
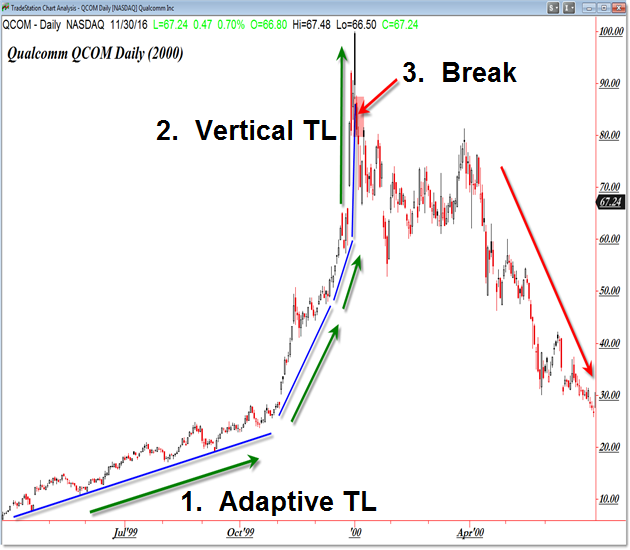
Here’s a similar pattern – one of many examples – of Qualcomm (QCOM) during the 2000 Tech Bubble Burst:

This example is clearer and occurs over a longer period of time.
We see the initial rally (ironically from $10 to $100) as we had to adjust our trendlines in a similar manner.
The trend progressed with a stable trendline toward the end of 1999 but euphoria took over the traders in November.
From there, you can see two adjustments to the rising trendline as price finally went “vertical” in December.
Price broke through the vertical trendline in January 2000 which marked the end of euphoria and the beginning of the collapse.
Like DRYS, price initially went sideways before collapsing into a rapid descent.
Study these two patterns and scan prior stocks to find similar patterns – it repeats and you’ll be ready next time you see the cycle repeat in real time.
Follow along with members of the Afraid to Trade Premium Membership for real-time updates and additional trade planning.
Corey Rosenbloom, CMT
Follow Corey on Twitter: http://twitter.com/afraidtotrade
Corey’s book The Complete Trading Course (Wiley Finance) is now available along with the newly released Profiting from the Life Cycle of a Stock Trend presentation (also from Wiley).”


These lessons are just so mighty helpful. If we are sensible then we could gain so much from it. I believe we just need to make sure we make enough effort to learn it all well. If we do that then there is plenty to be gained. Fortunately, I have ideal place to work it all out beautifully and that is with OctaFX broker through their ever amazing demo contest like cTrader, it’s ideal for practicing (learning) with having 400 USD prize as well!