Trade Planning in the US Equity Indexes from Current Range Reference Levels
The US Equity Indexes have formed a clear support range or rectangle price area between key short-term Fibonacci levels.
While that sounds more complicated than it actually is, let’s look at the key intraday and short-term critical support and resistance levels for trade and game-planning the next few swings in price.
We’ll start with the Hourly Chart of the SP500:

As we’ll see shortly, the SP500 is actually trading at a slightly lower level than its companion Dow Jones and NASDAQ equity indexes.
While the others are interacting with the 38.2% Fibonacci Level as the lower boundary of the short-term range, the SP500 actually formed its critical pivot point into the early May lows at the 1,625 inflection spot.
In each chart, I drew the short-term Fibonacci Retracement grid from the May high to the recent June low and we see each of the 38.2%, 50%, and 61.8% upward retracements as labeled.
For the SP500, the important levels for trade planning are the 1,625 support, 1,643 ‘midpoint’ resistance, and the upper boundary just shy of 1,655.
For trading purposes, we’ll continue playing bounces or “ping-pong” set-ups between these range boundaries.
For strategy and planning purposes, we will prepare to trade a breakdown under 1,625 to target 1,600 (very important support) or else a breakthrough above 1,655 to continue the higher frame uptrend and target 1,670, 1,685, and 1,700.
Note that the SP500 broke a falling ‘arc’ trendline on the spike-up (reversal) from 1,600. This is an example of how powerful ‘spikes’ can come from breakthroughs beyond arc trendline events.
The Dow Jones shows similar planning levels:

As I mentioned, the “Rectangle Range” in the Dow Jones has developed between the 38.2% (15,111) and 61.8% (15,277) Fibonacci Retracement grid.
The Midpoint of the pattern is 15,192 or roughly 15,200 for easy reference. Making it simple, the upper boundary is 15,275 while the lower boundary is 15,100.
Like the SP500, a breakdown under 15,100 suggests short-term bearish trades to target 15,000 then 14,850.
However, a bullish higher timeframe trend continuation event triggers above 15,300 which targets 15,400, 15,500, and (yes) 16,000.
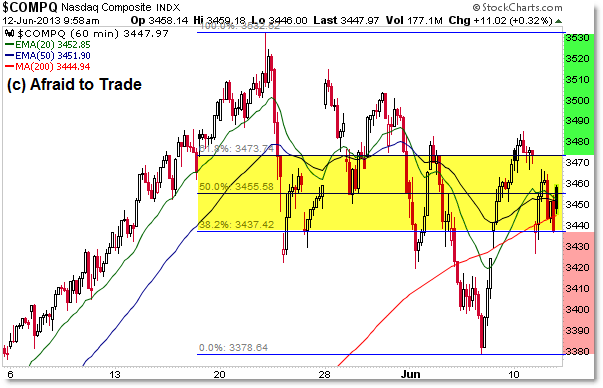
Finally, here are the NASDAQ range planning levels:

Like the Dow Jones, the boundaries have developed around the Fibonacci Grid. The upper resistance trades into 3,480 (3,473 is the 61.8% retracement) while the lower support level trades into 3,440 (38.2% at 3,437). We can draw a similar lower trendline into 3,420 to connect the ‘spike’ reversal lows.
The Midpoint of the pattern or ‘halfway inflection zone’ is 3,455.
Similarly, a downside breakthrough targets 3,420 and a failure under the ‘spike’ support of 3,420 targets 3,400 then 3,380.
A pro-trend continuation breakthrough above 3,480 that carries above 3,490 targets 3,510, 3,530, and beyond.
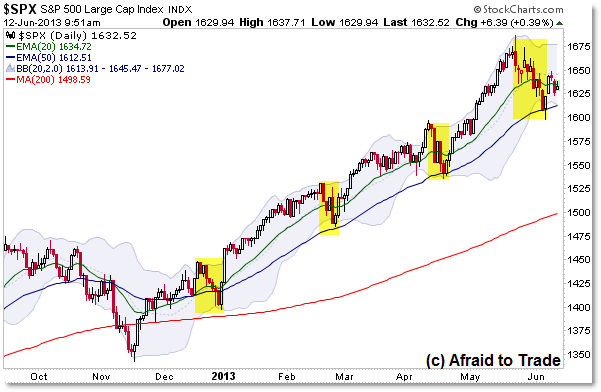
To put these intraday charts in perspective, here is a quick view of the SP500 Daily Chart:

The market is attempting a fourth successful pro-trend ‘flag’ retracement off the 1,600 key level (50d EMA) and after a two-day successful bounce, price stagnated into the 1,650 level and have traded loewr within the intraday patterns (range levels) shown above.
A bullish resolution would be expected above 1,650 to continue the strong pro-trend environment while a breakdown under 1,600 would be a signal of an official reversal of the short-term trend (the last time this occurred was October 2012).
Continue watching short-term/intraday price activity with respect to the higher frame thesis, monitoring whether this fourth retracement or ‘flag’ will succeed (with a push to new highs) or fail (under 1,600 targets a swift move back to 1,530).
Join fellow members to receive daily commentary and detailed analysis each evening by joining our membership services for daily or weekly commentary, education (free education section), and timely analysis.
Corey Rosenbloom, CMT
Afraid to Trade.com
Follow Corey on Twitter: http://twitter.com/afraidtotrade
Corey’s new book The Complete Trading Course (Wiley Finance) is now available along with the newly released Profiting from the Life Cycle of a Stock Trend presentation (also from Wiley).

Corey thanks for the timely report.
Get ready for a fierce sell off in equity investments as on Wednesday June 12, 2013,the Interest Rate on the US Ten Year Note, ^TNX, traded higher to 2.23%, pushing the 10 Year US Govenment Bond, TLT, down below support. Both Junk Bonds, JNK, and Aggregate Credit, AGG, traded strongly lower again today.
The chart of the EUR/JPY, seen in FXE:FXY, showed a tiny trade higher, on the Euro, FXE, trading slightly higher, and the Yen, FXY, trading slighly lower. The Acton Forex EURJPY chart pattern with close at 129.243 suggests a massive unwinding of this currency carry trade is imminent.
World Stocks, VT, and most all stocks gapped open higher and fell all day producing a red filled candlestick, sometimes called Red Filled Elder Bar Chart Pattern. World Stocks, VT, and US Stocks, VTI, traded lower to the very edge, that is the precipice of support. Not a single equity ETF traded higher today, And the only credit ETF trading higher was Emerging Market Bonds, EMB, which have been selling massively lower lately.
Paper Producers, WOOD, traded lower on a lower price of Timber, CUT, with Biotechnology, IBB, Semiconductors, SMH, Clean Energy, PBD, US Infrastructure, PKB, Retail, XRT, Internet Retail, FDN, Global Industrial Producers, FXR, Dynamic Media, PBS, and Small Cap Pure Value RZV, trading lower as well.
Investment Bankers, KCE, such as JP Morgan, JPM, Asset Managers, ASMA, such as Blackrock, BLK, the Too Big To Fail Banks, RWW, such as Cititgroup, C, traded lower. Regional Banks, KRE, traded lower, taking the US Small Caps, the Russell 2000, IWM, lower.
Countries trading lower included Thailand, THD, and China, YAO, on lower China Real Estate, TAO, and China Industrials, CHII. Spain, EWP, traded higher, but Greece, GREK, and Italy, EWI, traded lower. This as Ambrose Evans Pritchard writes Italian showdown with Germany over euro looms closer. Mexico, EWW, Brazil, EWZ, EWZS, Singapore, EWS, EWSS, traded lower. And Egypt, EGPT, literally collapsed, falling 4.0%
All of the Yield Bearing ETFs, traded lower today. Preferred Financials, PGF, fell strongly lower. And Small Cap Real Estate, ROOF, Mortgage REITS, REM, Industrial Office REITS, FNIO, Residential REITS, REZ, and Premium REITS, KBWY, traded lower on today’s higher Interest Rate on the 10 Year US Government Note, $TNX.
The chart pattern of Oil, USO, traded higher to strong resistance at 34.03, like that of World Stocks, VT, and US Stocks, VTI, portending a likely strong drop tomorrow or later this week. Bespoke Investment Group writes Crude oil and gasoline inventories rise more than expected
Volatility, ^VIX, TVIX, rose in an Elliott Wave 3 breakout. The market Risk Off ETN, OFF, reads positive, warning investors to be out of long positions.
The Yahoo Finance ongoing one month chart of Utilities, XLU, Real Estate, IYR, and Closed End Equity and Closed End Credit Funds, CSQ, PTY, AWP, PFL, RCS, and EIM, shows that the Interest Rate Sensitive Investments have taken a massive trade lower.
Trading today in Closed End Funds, CSQ, PTY, AWP, PFL, RCS, and EIM, was decisively lower. Closed End Debt, PFL, traded very strongly lower, and Closed End Equity, CSQ, traded strongly lower, showing that the way is now lower for both credit and equities.
I am left with a feeling that a massive turn lower in the stock market is imminent. All I can say is “lookout below!”
Please consider that God purposed from eternity past to produce Liberalism to make America Great acting with Global US Dollar Hegemony, as is seen in the Statue of Empire prophecy of Daniel 2:25-45, only to introduce Authoritarianism and its ten toed kingdom of regional governance.
The financial market action that is seen today is Jesus Christ acting in dispensation, that is in administrative management of the household of God, Ephesians 1:10, fully completing Liberalism’s democratic nation state, banker regime, and the age of investment choice, and introducing Authoritarianism’s regional governance, totalitarian collectivism, beast regime and age of diktat as foretold in Revelation 13:1-4