Trading Opportunities from July Consecutive Up Closes Stock Scan
During the recent non-stop bullish price rally, which stocks have closed the most days in a row to the upside?
Let’s take a look at our updated stock scan results and spot two specific trading opportunities in the list.

Using TradeStation’s Stock Screener tool, we find the following stocks have the most consecutive daily chart closes to the upside.
CBRE Group (CBG) tops the list with 10 straight up-days in a row, followed by Time Warner (TWX) and Delphi Automotive (DLPH).
You can use the other stocks on the scan to find possible “fade” or reversal strategies during a possible “overbought” or “over-extended” swing, or else you can use this list as a possible relative strength pro-trend scan to buy into a rising trend in a strong stock in an uptrend.
Let’s take a look at two specific trading opportunities from the top of this list:

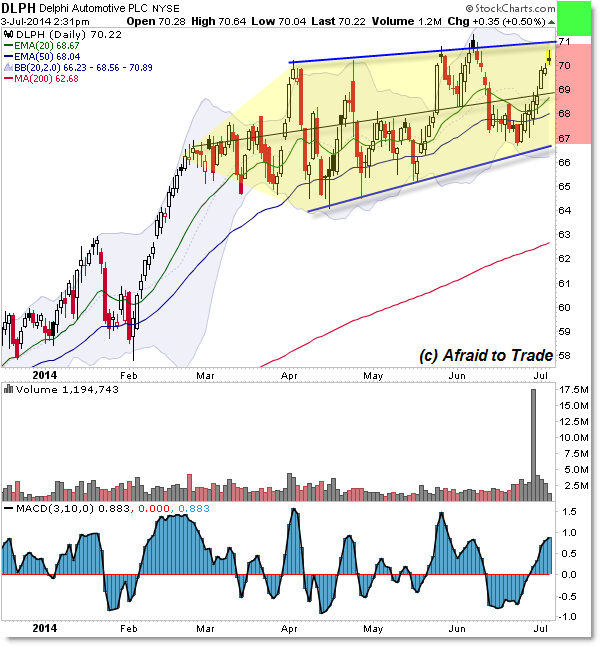
Delphi Automotive (DLPH) has an interesting short-sale (fade) potential trade set-up into the current resistance near $71.00 per share.
Note the rising rectangle trading range I highlighted and the upper trendline into the $71.00 area.
The prior price high or reversal (fade) price triggered just above $71.00.
Watch that area closely for a future retracement back to the $67.00 lower rising trendline target (or at least the Midpoint into $69.00 per share).
Otherwise, a surprise breakthrough above $71.50 could trigger a powerful short-squeeze pro-trend bullish breakout opportunity for aggressive traders (always be prepared for unexpected outcomes).
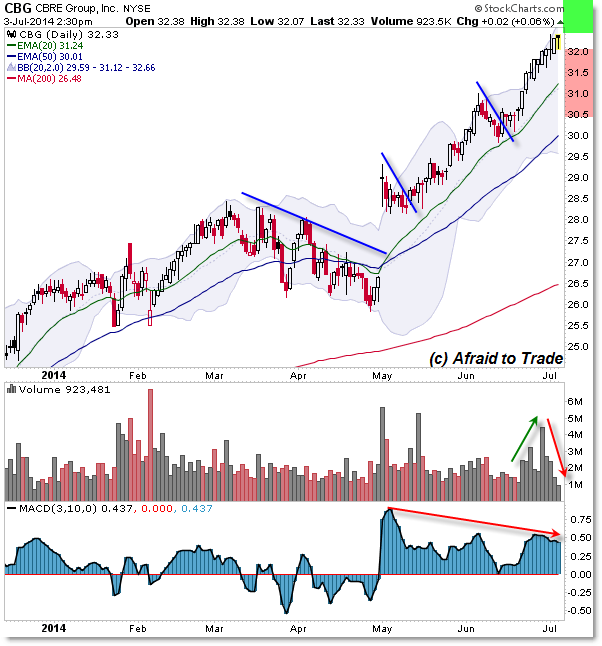
Our second opportunity comes from CBG – the stock with the most consecutive up-closes at the moment:

CBRE Group reminds us why it is ill-advised to fight or fade a strong trending stock.
Instead, view the two recent retracements of “flag” set-ups to the rising 20 day EMA as a simpler spot to buy shares into a rising trend (placing your stop under the rising 20 day EMA).
Nevertheless, price rarely travels straight up; it tends to retrace (like the red flags) in the context of an uptrend.
When price extends or travels away from the rising 20 day EMA – especially above the upper Bollinger Band – odds tip to favor a retracement or “fade” set-up as opposed to additional upside action.
Right now, price is overextended above the $32.00 per share area and could pull-back or retrace lower.
Alternately, traders may want to keep this stock on a watch-list and buy into the rising trend should the logical pullback/retracement occur.
Simple stock-scans can provide great trading opportunities in companies that you may have missed otherwise.
Follow along with members of the Daily Commentary and Idealized Trades summaries for real-time updates and additional trade planning.
Corey Rosenbloom, CMT
Afraid to Trade.com
Follow Corey on Twitter: http://twitter.com/afraidtotrade
Corey’s book The Complete Trading Course (Wiley Finance) is now available along with the newly released Profiting from the Life Cycle of a Stock Trend presentation (also from Wiley).

