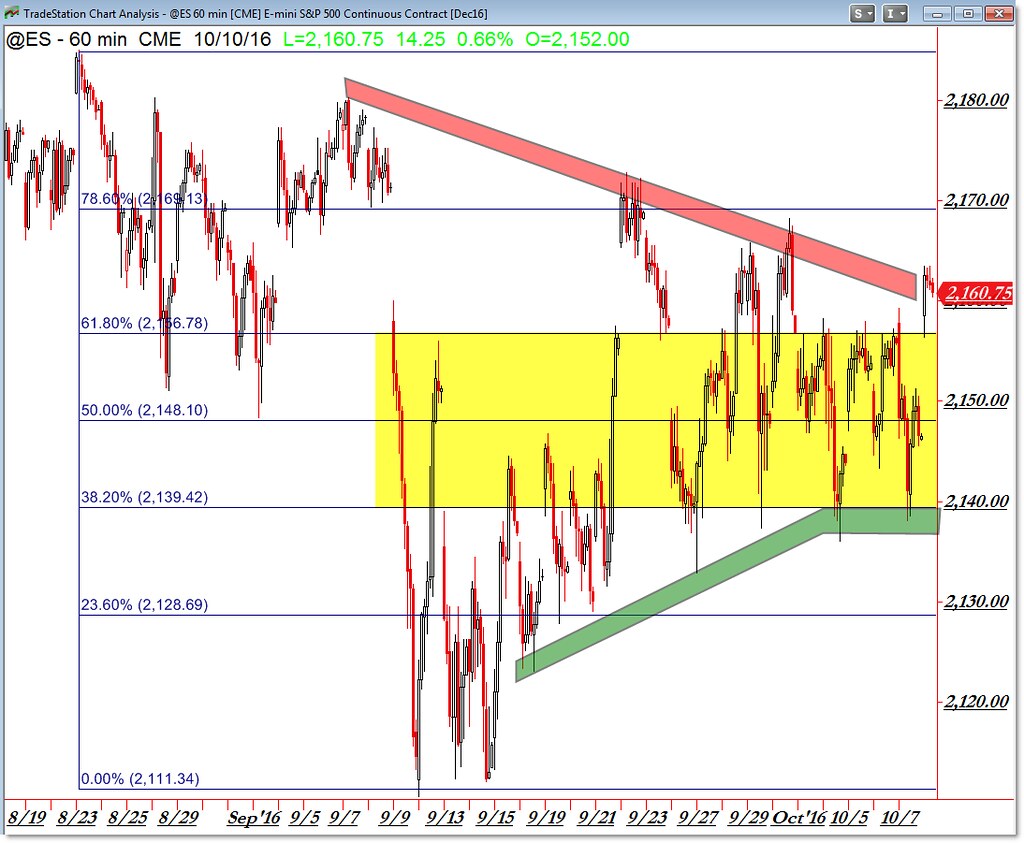
Triangle vs Fibonacci Emini Update October 10
What’s superior – the Triangle Pattern or our Fibonacci Grid? Or both?!
Here’s today’s updated Fibonacci and Emini (@ES) trading levels for your trades:

Here’s a reference guide of how to use and trade from these morning updates.
We’ve been highlighting the Symmetrical Triangle (red/green) in our plans and we’re seeing price bounce up away from the lower boundary (and 38.2% Fibonacci Level) to the upper trendline (above the 61.8% level).
The main idea is that there is a gravitational force – a Magnet – between 2,139 and 2,157 in the @ES.
We’re seeing a push up through this level into our upper trendline.
IF price continues higher THEN we’ll expect a movement toward 2,169 or higher.
However, if the triangle holds price and pulls it lower – like a Magnet – then we’re bearish under 2,160.
Want these levels and additional strategy planning in advance each evening?
Get these levels in advance with in-depth planning and trading opportunities by joining the Daily Membership.
Follow along with members of the Afraid to Trade Premium Membership for real-time updates and additional trade planning.
Corey Rosenbloom, CMT
Follow Corey on Twitter: http://twitter.com/afraidtotrade
Corey’s book The Complete Trading Course (Wiley Finance) is now available along with the newly released Profiting from the Life Cycle of a Stock Trend presentation (also from Wiley).


I think both have their own benefits and if we use properly then there is plenty to be gaining from, so that’s why we need to practice a lot on demo and learn about our strength and weakness. I never have to worry about ordinary demo because I can work on better place in cTrader demo contest with OctaFX which is awesome with been weekly based yet got 400 dollar prize to be won, so all works nicely and allows me to be comfortable.