Triple Fibonacci Confluence Reveals Trapped SP500 – Key Levels to Watch for Breakout
Are you confused as to why the S&P 500 has been trapped in a tight range the last few weeks?
Perhaps a look at key long and short-term Fibonacci retracements can help – in fact, looking at the recent Fibonacci grid can give you one of those “A-Ha!” moments.
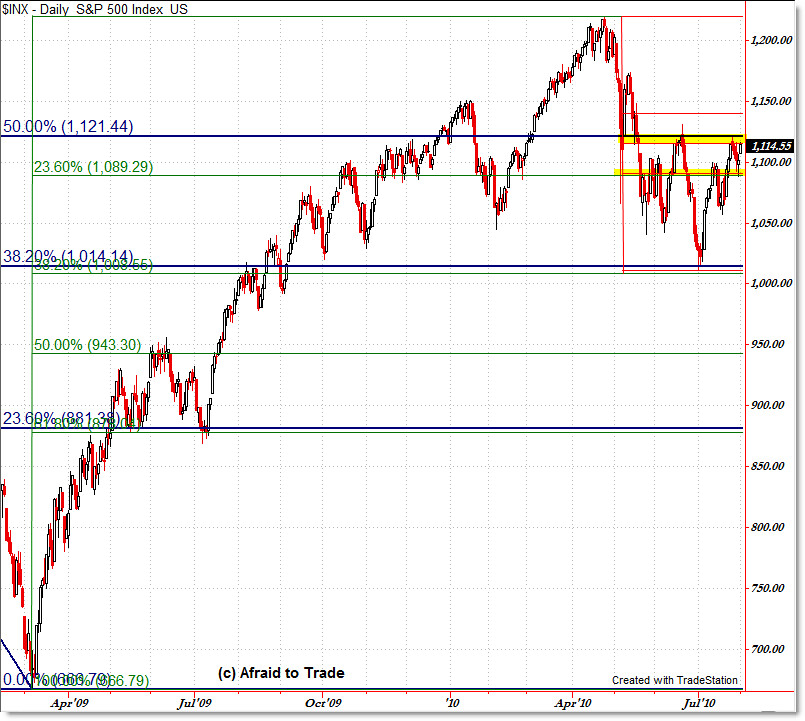
Let’s take a look at the grid and I’ll explain where the retracements come from and how they’ve converged right here right now:
(Click for full-size image)
To draw a Fibonacci Retracement grid, start with a major high, draw to a major low (or vice versa) and the computer software auto-generates the 38.2%, 50.0%, and 61.8% retracements.
That’s what I’ve drawn in the chart above, only adding the 23.6% ratio to the chart.
Here are the levels from which I drew the key Fibonacci retracement grids you see above:
BLUE GRID:
From the 1,576 high in October 2007 to the 666 low in March 2009 (shows retracements on the way up):
23.6%: 881
38.2%: 1,014
50.0%: 1,121
61.8%: 1,228
GREEN GRID:
From the 666 low in March 2009 to the 1,219 high in April 2010 (shows retracements on the way down):
23.6%: 1,089
38.2%: 1,008
50.0%: 943
61.8%: 878
RED GRID
From the 1,219 high in April 2010 to the 1,010 low in July 2010 (shows retracements on the way up):
23.6%: 1,060
38.2%: 1,090
50.0%: 1,115
61.8%: 1,140
I’ll let the chart speak for itself, but the main idea is that we have a dual Fibonacci confluence at the 1,115 area along with a dual confluence support at 1,090.
The big number to watch today is the 1,121 retracement level (blue) from the 50% line of the “Entire Bear Market” retracement.
A break outside of either one of these areas – 1,120 as upside resistance and 1,090 as downside support – likely results in a move to the next level, which would be 1,140 to the upside and 1,060 to the downside.
A break beyond that, however, changes the game and breaks the market out of this really weird confluence of so many timeframe Fibonacci levels and would argue for a continuation move – upwards to the 1,200 level if above 1,140 and back down to 1,010 if under 1,060.
As traders, we don’t try to predict, but instead take opportunities and manage risk – Fibonacci grids like this can help you set up the contingency plans using “IF/THEN” statements (in terms of entries and targets).
Keep this reference grid handy and watch price as it tests these levels.
Corey Rosenbloom, CMT
Afraid to Trade.com
Follow Corey on Twitter: http://twitter.com/afraidtotrade


Corey, have you done wave analysis on 60 minute time frame? It looks like current move is wave 5, with both wave 2 and 4 retracing 50% of previous impulse waves. It will be great if you could comment/post about that.
Thanks for a great blog.
SA