Triple Timeframing Critical Support for Gold April 13
The gold market has been in a deeper retracement than many traders expected, and now price challenges a critical support level as seen from all three major timeframes.
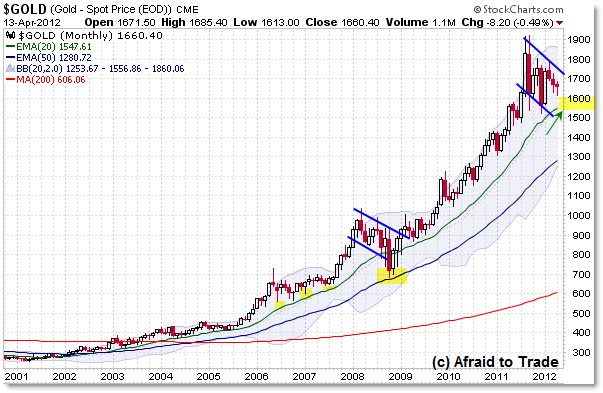
Let’s start with the Monthly Frame and then drill down to the Daily Chart to pinpoint this critical level we’ll all be watching:

Instead of going into detail on the charting picture of gold, I wanted to draw your attention to the reference levels to watch on these three timeframes.
The Monthly Chart shows a persistent, Primary Uptrend with rising price and EMAs.
The key to watch here – beyond the simple $1,600 “Round Number” level – is the rising 20 month EMA near $1,550.
With the exception of late 2008 (during the heart of the global financial crisis), gold has remained – and bounced off this key EMA repeatedly… though it hasn’t touched this level officially since mid-2009.
It would be a very big deal in the event Gold broke under the rising 20 month EMA. Thus, keep focused on this ‘bigger picture’ moving average.
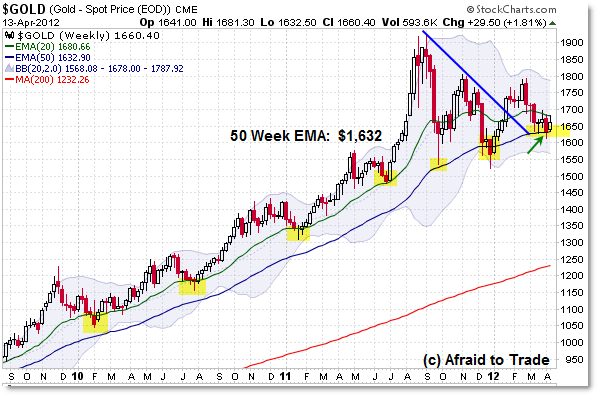
The Weekly Chart shows an even closer key EMA to watch:

The rising 50 week EMA rests currently at $1,632 (roughly $1,630 for easy reference) and has played an important support role for price.
The only exception was December 2011 when price broke this level for one month then rallied sharply above it in January 2012, triggering a nasty Bear Trap.
Price recently “spike” supported off this average during the September 2011 crash and prior to that, continued to support steadily off the rising 20 week EMA.
In fact, price is showing what I like to call “EMA Compression” which means price is currently using the falling 20w EMA as resistance along with the rising 50w EMA as support.
The suggestion is that price must eject in one direction or the other – it can’t stay between compressing EMAs forever.
For reference, the falling 20w EMA rests at $1,660.
It would be a critical development if sellers pushed gold under the $1,630 then $1,600 area.
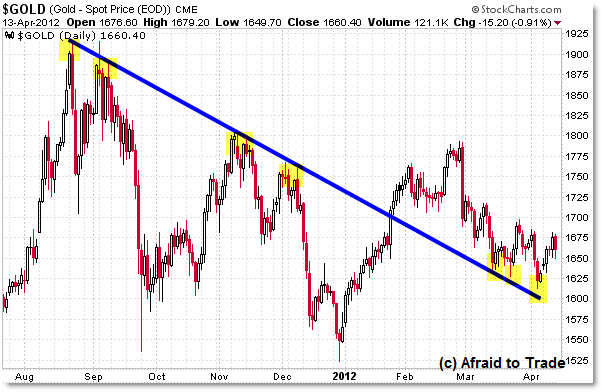
Finally, we have an interesting “Riding the Trendline” development as seen on the Daily Chart:

During January 2012’s power-rally, gold broke firmly above a falling “Flag” trendline at the $1,700 area. This triggered a buy/bull bias and led to a continued push towards the $1,800 target (’round number’ resistance along with the November 2011 swing high).
Price failed to overcome this level, which brings us to our current – somewhat unexpected – continued retracement and situation where price is “Riding the Trendline.”
We often refer to numbers for Polarity – meaning a level that has served as both prior support AND resistance – but we can observe the same concept using hand-drawn trendlines like the one above.
In other words, the falling “flag” trendline that served as resistance four times from August to December 2011 has subsequently served as support three times recently in 2012.
While this is a descending trendline, it would – you guessed it – be a critical development should sellers break the price back under the falling trendline which currently is traveling under $1,600.
Taken together, we have a critical MONTHLY level to watch near $1,550 along with Weekly and Daily levels nearing the $1,600 simple reference level.
For the short-term picture, gold appears objectively bullish on a breakthrough beyond $1,700 and is neutral between $1,600 and $1,700 and of course bearish underneath these ‘triple timeframe’ nearby support levels.
We’ll be watching all three levels closely in the weeks ahead.
Corey Rosenbloom, CMT
Afraid to Trade.com
Follow Corey on Twitter: http://twitter.com/afraidtotrade
Corey’s new book The Complete Trading Course (Wiley Finance) is now available!

Instead of falling wedge, i also see Converging Triangle on Monthly with a down target of 1300