Triple Timeframing the Breakdowns and Levels in BAC
With bad earnings putting Bank of America (BAC) in focus today, what is the message from the triple-timeframe structure of the charts in the stock?
Let’s take a look starting with the monthly frame and drilling down to the daily chart, noting key levels and lessons along the way.

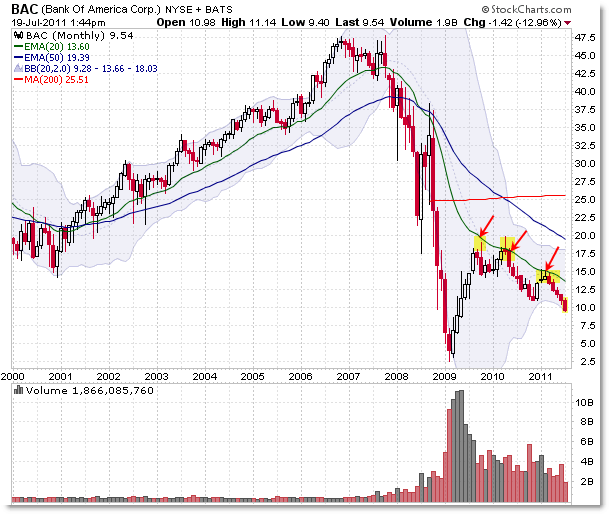
With the exception of a “Last Gasp” bounce in late 2007 (the Stock Market peak), Bank of America shares peaked structurally in late 2006.
We saw the first breakdown of the rising 20 month EMA (a key reference during the multi-year bull trend) which gave way almost immediately to a breakdown under the rising 50 month EMA in December 2007.
From there, the stock spiraled out of control during the financial crisis of 2008.
During the recovery/rally phase in 2009, the stock retraced to the key falling 20 month EMA as labeled, and price failed to rally beyond this key falling average on two additional tests (touches) in 2010 and recently in 2011.
Price has since returned to a structural downtrend and remains under the falling average – giving us a backdrop to interpret the lower frames.

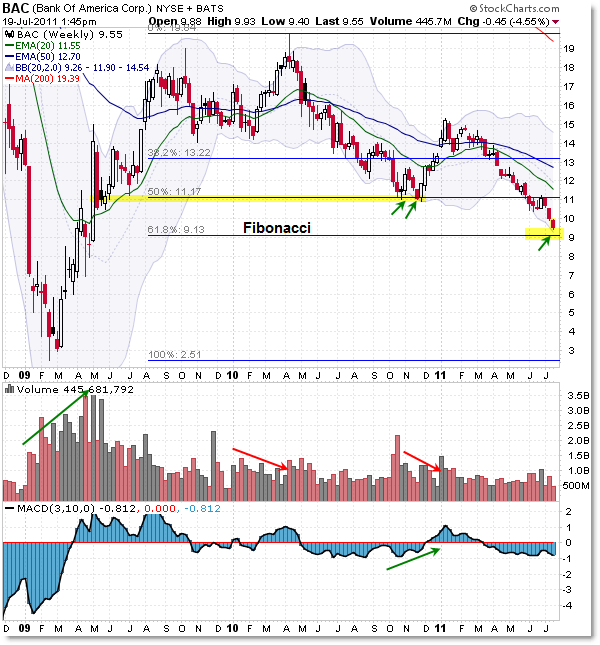
I chose to focus mainly on the weekly chart as it does the best job of showing current structure and critical levels.
I drew a simple Fibonacci retracement grid from the 2009 low of $2.50 to the $19.80 recovery high in April 2010.
Shares rallied from a double-bottom and divergence at the 50% Fibonacci retracement ($11.00 per share) during the end of 2010 which took us into the 2011 peak.
From there, as seen in the monthly chart, price again failed to overcome the falling 20 month EMA and shares have since declined for the year in the context of the larger structural downtrend.
The key reference level to watch here is the final 61.8% Fibonacci Retracement at $9.13 – or $9.00 per share for easy reference.
We’ll be looking for buyers to defend this level, but a failure to hold the key support at the $9.00 level argues that no further obvious higher timeframe support levels would exist.
In other words, $9.00 is a key ‘make or break’ chart level that buyers and sellers will be watching – and perhaps positioning – closely.
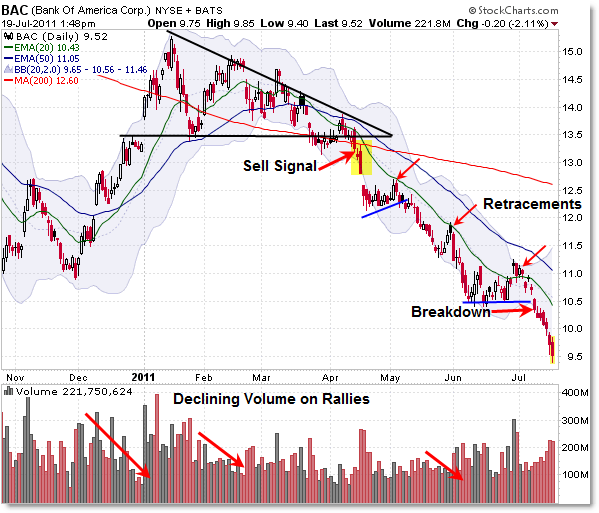
Let’s now drop the perspective to the picture so far in 2011 as seen from the Daily Chart:

I first wanted to show a few trading lessons/examples that triggered on the daily chart (for swing traders) that occurred in the context of the higher timeframe bearish structure.
The first major sell signal in 2011 arose from a breakdown of both the 200 day SMA (red line) and horizontal support – Descending Triangle Pattern – at $13.50 per share.
Notice the two big sell bars – bearish control – that accompanied the breakdown in April and the volume spike that formed – these confirmed the expectation/probability for future lower prices ahead.
From there, I’m showing three simple low-risk retracement entries (short-sales) in the developing sell-off – all of which occurred with a pullback to the falling 20 day EMA.
Aggressive (risk-tolerant) traders look to sell-short INTO resistance (incorporating intraday structure if possible) which allows for a tighter stop; conservative (risk-averse) traders look to sell-short on a breakdown of a rising trendline (bear flag) after price moves into resistance.
The most recent sell-signal was on the retrace to the $11.00 area and the breakdown under $10.50’s horizontal support.
It’s a little late in the party to rush in short at the moment, given we’re about 50 cents above the critical weekly Fibonacci Level at $9.10 per share.
In terms of risk/reward, a swing trader might want to see how buyers react here just above the weekly key support area at $9.00.
A firm breakdown under the potential/expected support at $9.00 would trigger another breakdown sell-signal, though traders should always approach set-ups/entries/management depending on their experience levels and individual strategies.
If you’re a trader in BAC shares, or just watching the stock with regards to the Financial Sector, monitor structure and the outcome of the “Battle for $9.00” that’s likely to unfold soon.
Corey Rosenbloom, CMT
Afraid to Trade.com
Follow Corey on Twitter: http://twitter.com/afraidtotrade
Corey’s new book The Complete Trading Course (Wiley Finance) is now available!

You do a great job on being descriptive enough without being overly descriptive. Great way to show off the triple screen. Cheers from North Carolina
Rob
Great analysis, Corey.
So much for a $21 book value.
Banks haven't bounced meaningfully for some time, glad I have not traded them this year.
Your work is inventive and valuable. Thank you for this fascinating post! Operators should always set-ups/entries/management approach depending on the level of experience and individual strategies.