Triple US Stock Market Index Chart and Level Update
This morning’s Jobs Report was the catalyst that continued the rally off support as price challenged the underside of new all-time highs.
Let’s take a “Triple Index” Perspective of the trend, consolidation, and key levels to highlight right now.
We’ll start with the S&P 500:

In January, price bounced back and forth between the 2,000 and 2,065 level in a trading range ahead of a February breakout to new all-time highs.
A March retracement preceded the current sideways trading range between 2,060 (and support recently rose to 2,080) and 2,120 levels.
Both events highlighted a 60 point range with support and resistance as price played ping-pong between these key levels.
It’s hopefully no surprise that the index is back into the upper resistance level again as the range continues.
We’ll again focus on the 2,120 S&P 500 level as a possible breakout buying opportunity (beyond 2,125 and higher) or another retracement down against this level should sellers step up their game and continue the trading range rectangle.
The Dow Jones paints a similar picture:

January’s rectangle range developed between 17,200 and 17,850 ahead of the February breakout.
Similarly, the March retracement developed a support level into 17,600 that extended toward the 18,200 level.
While support rose in April to 17,800, the 18,200 level remained firm resistance.
For planning purposes, either the range continues (with a bearish swing coming up next) or buyers dominate the market agian, breaking it out to new all-time highs in a multi-day upside rally.
Either way, 18,200 is our resistance zone on which to focus our attention and trading strategies.
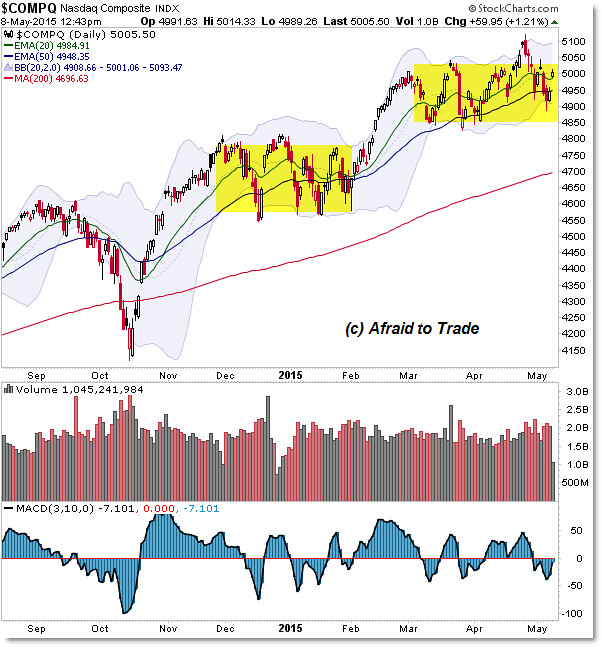
Finally, the NASDAQ looks a little different:

December and January saw a two-month sideways trading range between the 4,600 level and 4,800.
A February breakout propelled the NASDAQ straight up – crushing short-sellers – to the important 5,000 level at which point the March to April two-month rectangle developed.
Officially, we’re watching the 4,850 to 5,050 (easy reference) levels as key pivot points.
A Bull Trap (see my prior post on the Bull Trap and how to recognize it and the “Bearish Engulfing Candle at the Highs“) crushed price back to the 4,900 pivot support ahead of this week’s bullish surge off 4,900 to 5,000 (and possibly higher).
We’ll use the 5,050 level as a bull/bear short-term reference level where 5,100 is easily in play should buyers push the market slightly higher and bears/short-sellers respond by triggering stop-loss (buy-back to cover) orders.
Follow along with members of the Daily Commentary and Idealized Trades summaries for real-time updates and additional trade planning.
Corey Rosenbloom, CMT
Afraid to Trade.com
Follow Corey on Twitter: http://twitter.com/afraidtotrade
Corey’s book The Complete Trading Course (Wiley Finance) is now available along with the newly released Profiting from the Life Cycle of a Stock Trend presentation (also from Wiley).


2 Comments
Comments are closed.