Tuesday Selloff in Crude Oil Also Returns us to the 50 day EMA
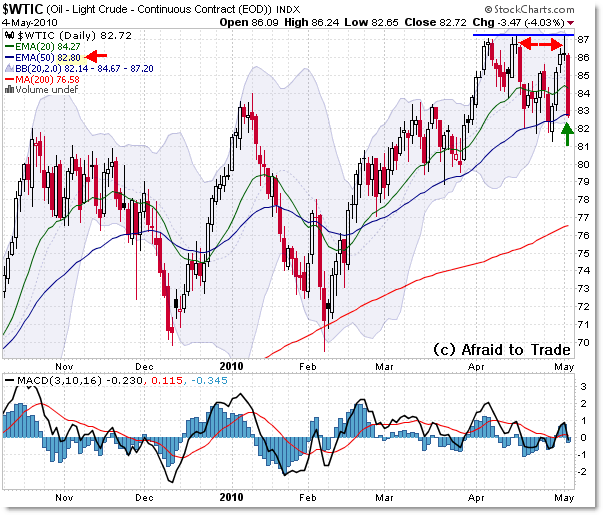
Traders paid a lot of attention today to the S&P 500 testing its rising 20 day EMA, but what you may have missed today is that Crude Oil did the exact same thing and now rests on its rising 20 EMA critical support line.
Let’s take a look at the chart and then see how oil made the rounded-reversal sell-off that took us to where we are now.

Similar to the S&P 500, Crude Oil also rallied through March and consolidated through most of April, leaving a ‘rectangle’ of support at the $87.00 and $82.00 level.
Notice the last three times Crude Oil tried to break through the $87.00 wall of resistance – it formed doji candles each time prior to the sell-off to test lower support.
Perhaps we should have seen this coming? At least the odds were favorable to a sell-off.
For now, we’re back at the lower support zone and at the rising 20 day EMA just shy of $83.00.
The key will be watching the $81.00 level, as any breakdown beneath that will break the short-term trend (reversal) to place us squarely with a test of the $79.00 prior price low level from March.
Beneath $79… and we have ‘open air’ (chart-wise, that is) back to $70… but we’re not quite there yet.
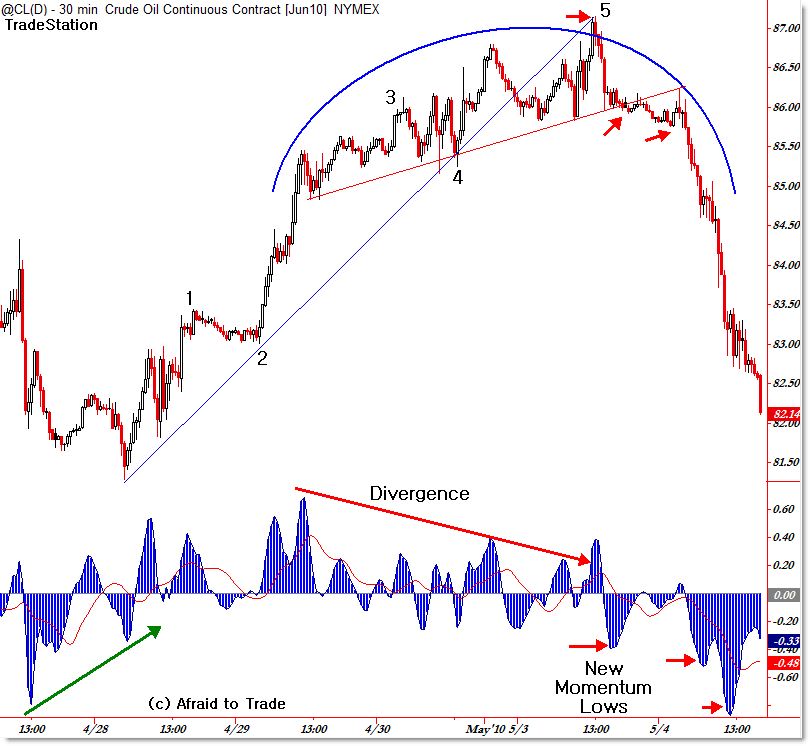
Now let’s step back and learn a lesson from the recent short-term (intraday) turn-around in price that comprised a nice Elliott Fractal and Rounded Reversal (one of my favorite patterns).
This chart mostly serves as a reference about how a price swing matures from an upswing to a ’rounded reversal’ (complete with negative divergences) then breaks trendlines to complete a nice “mirror image” sell-off pattern.
It happened also to form a nice Elliott Wave Fractal (5-wave impulse) that was complete with a new momentum high on the 3rd wave and a lengthy negative momentum divergence that ended the 5th wave.
However, divergences themselves are often not sufficient to execute reversal trades – that takes the breaking of established trendlines as shown.
Price and momentum both began to make new swing lows, forecasting lower prices yet to come… and we see the result.
This chart is a good example of a market in short-term (intraday) transition.
Compare it with the doji candle that formed yesterday at the key resistance level of $87.00. It was very high risk to remain long (short-term) in such conditions.
These are some of the concepts and opportunities I discuss in each week’s Inter-market Report for members.
For now, keep a watch on the support levels going forward and the structure we see on the intraday charts (will we start to see positive divergences?) in the next few days.
Corey Rosenbloom, CMT
Afraid to Trade.com
Follow Corey on Twitter: http://twitter.com/afraidtotrade


And we are going to 70 fast!
THere should be some good small cap oil and nat gas stocks that will do well on this oil and market sell off. I like EROC, DNE, and some others, but I also like UNG to do sell.