Updated Chart View of SDS June 12
With the market sell-off and retest of the February lows, what does the chart of the SDS – the ProShares 2x short S&P 500 – chart look like?
Let’s take a look to see what lurks beneath the surface.
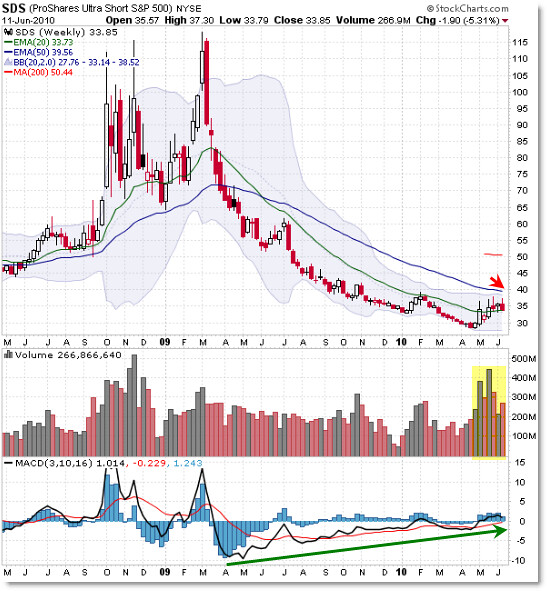
SDS Weekly:

The weekly chart actually takes us back to the “Crash” of 2009.
Just kidding – remember the SDS is the DOUBLE short (inverse) S&P 500, so moves – especially as the S&P 500 rallies sharply – are exaggerated.
The move off the March 2009 low resulted in a one-week move down 30% from $115 to $80 at the same time the S&P 500 moved up 13% from 670 to 760. That is a whole different story than the present.
Like the S&P 500 had a lengthy negative momentum divergence from May 2006 to the peak in April 2010, the SDS formed a massive positive divergence during the same period.
Volume surged to new 2010 highs – actually to levels not seen since October 2008 – during the 2010 sell-off phase.
With the weekly chart in mind, let’s drop down to the daily frame.
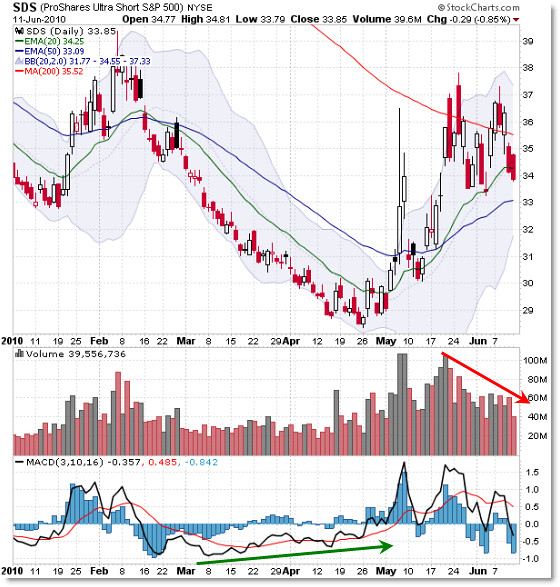
SDS Daily:

We see a similar short-term positive divergence from March to May 2010 as we saw with a negative divergence in the S&P 500. It’s always good to cross-check inverse charts for similar structures.
One thing you might notice – or at least should notice – (and know for a fact if you trade SDS actively) is that SDS did not rise to a new high when the S&P 500 retested (actually fell under) its February low.
The February low in the S&P 500 was 1,044 and the May low was 1,040.
The SDS February high was $39.40 while the May high peaked at $37.80.
Keep this in mind – performance of a leveraged ETF is not always exactly the same as the underlying index – that’s why you should track both the ETF and index closely and read the prospectus very carefully.
That said, we see a negative divergence, or at least a drop-off in daily volume from the recent ‘crash’ situation in May. That could be interpreted as bullish… or at least “less bearish” for now.
Double and triple leveraged funds may be great for day-traders and short-term swing traders, but do be careful when trading these vehicles and know the risks and rewards of these unique funds.
Corey Rosenbloom, CMT
Afraid to Trade.com
Follow Corey on Twitter: http://twitter.com/afraidtotrade

believe I see an Elliott Wave count in SDS:
Wave 1 up to 33.97
Wave 2 down to 30.16
Wave 3 up to 36.01
Wave 4 down to 33.70
Wave 5 up to 36.71 ….. This completes 1 up
now its down, yes I believe further down to 33, 32 or 31 for wave 2 down …. and then lookout …. wave 3 begins. This will be like wow big.
Currently the Euro, FXE, is rising; when it finishes, then SDS will stop falling and go upward and onward quite dramatically as the Elliott Wave 3s are quite expansive creating wealth on their way up and destroying wealth on their way down.
Given the possibility of another large market downturn should we break 1040 on the S&P 500, has anyone factored in the new market measures that are supposed to prevent such massive sell-offs and how this would factor into the technical analysis. This does seem to change the game somewhat.
Of course, being a derived index, you should turn upside-down all the Elliott Wave statements as they refer to the primary index, SPX. And, I believe that's exactly what R. Prechter's site is reporting about SPX. He himself has been talking about the lack of pessimism after this first correction (beginning late Apr thru now) as a classic signal that the next leg up is a Wave #2 of a five-piece wave. He's a smart guy thinking about the right things.
I'm pretty ignorant of how stock folks speak of fractal, (misspeak, to some extent), but as a math guy, I do notice the market does episodically enter into self-similarity for a few powers of magnification for certain windows of time. The problem, of course, is having a generating function to explain those episodes of self-similarity and how they phase in and out, not necessarily in synch with each other, which self-similarity demands. Nonetheless, reading about socionomic theory and price-time signals and wavelets riding inside the larger waves makes for good thinking.