Updated Look at Crash Recovery in GS and BP
Goldman Sachs (GS) and British Petroleum (BP) no doubt have been widely covered in the media, both with negative coverage in the wake of two unrelated events – a lawsuit for GS and the Gulf oil spill for BP.
Despite their differences, their chart patterns remain similar, and this update shows the positive divergences forming as both of these stocks angle to form a bottom and rally off support.
Let’s first take a look at Goldman Sachs (GS):

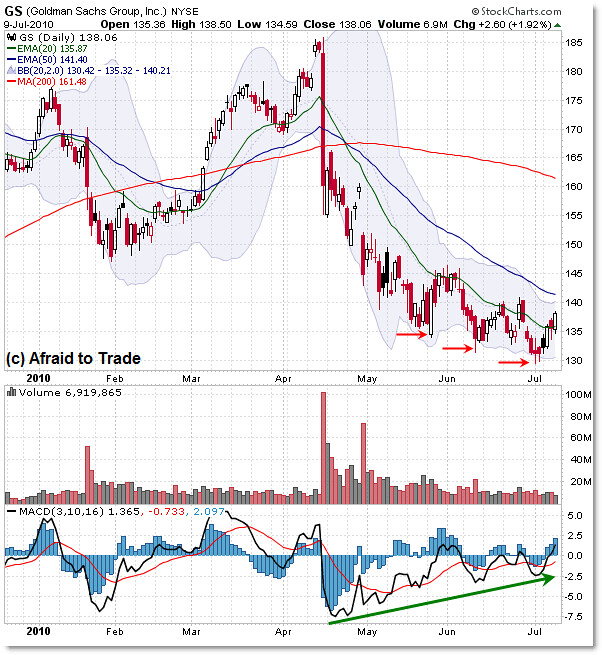
The big drop happened on April 17, sending shares in a one-day drop from $185 to $155 as the SEC announced legal action against Goldman Sachs.
Despite minor bounces – falling knives actually – the stock has continued to make new lows, most recent of which was the early July low at $130.
I posted not long ago about the importance of $130 for Goldman Sachs, and that level still holds true. Check the prior post for reasons why.
So far, Goldman shares have held that critical level, and any move above the declining 50 day EMA at $141 currently argues for a bottom at $130 and rally/recovery higher.
A break under $130 is a much different story – so watch $130 very closely.
As for BP, the situation is similar:

Keep in mind this post is in regard solely to the chart positions and technical analysis of these stocks – a lawsuit and responsibility for a massive oil spill are very different fundamental analysis occurrences.
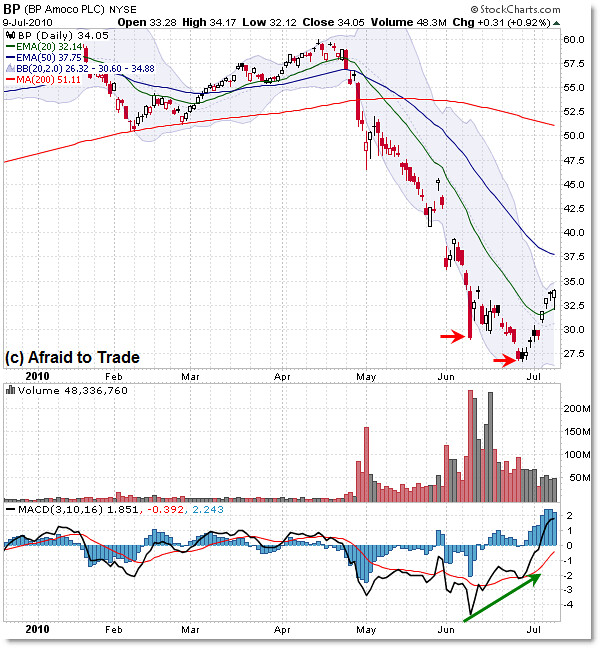
That being said, BP shares rallied sharply the last two weeks off the $26 per share bottom in late June. Notice that the rally began from a clean positive momentum divergence.
Is there any other significance perhaps to the $27.50 level? Good question – absolutely.
The $27.50 level was the absolute bottom in the 2003 bear market low for BP – and price found support once again at that critical level.
The bounce higher – from a technical analysis standpoint (test of major support on a positive momentum divergence) is thus the expected and logical play.
While these stocks clearly are different, they both bounced off critical support prices – $130 for GS and $26 for BP – and that’s very interesting.
The determinant whether this is just another bear market rally, or the start of a new up phase will come at the break above prior highs and the 50 day EMA – situated at $145 for Goldman Sachs and $40 ($38) for BP.
Watch those levels as well as the critical support prices for these unrelated stocks but very important – and newsworthy – stocks.
Corey Rosenbloom, CMT
Afraid to Trade.com
Follow Corey on Twitter: http://twitter.com/afraidtotrade

One Comment
Comments are closed.