Updating SP500 Structure and Support for July 9
The S&P 500 currently rests near a midpoint of the recent swing high and low, but there’s a key support level we’re watching for clues as to which level to target next.
Let’s update the current S&P 500 near-term support and structure chart, starting with the Daily Frame:

Keeping the chart as simple as possible, the key reference level this week will be the 1,340 EMA and Fibonacci (seen below) cluster.
A successful defense of support here suggests a play back to the recent 1,375 high while a failed support defense opens the target back to 1,320 or even 1,300 on a sharper sell-off.
Let’s take it one factor at a time – the 20 and 50 day EMAs converge (cross) just above 1,340 (1,343 and 1,341) and will be an indicator-based level to watch for a potential reversal.
Should this support level fail soon, we’ll reference the broader “Flag” or rising parallel trendline structure currently situated at 1,330 (support) and 1,380 (resistance). This would be similar to a rectangle consolidation pattern.
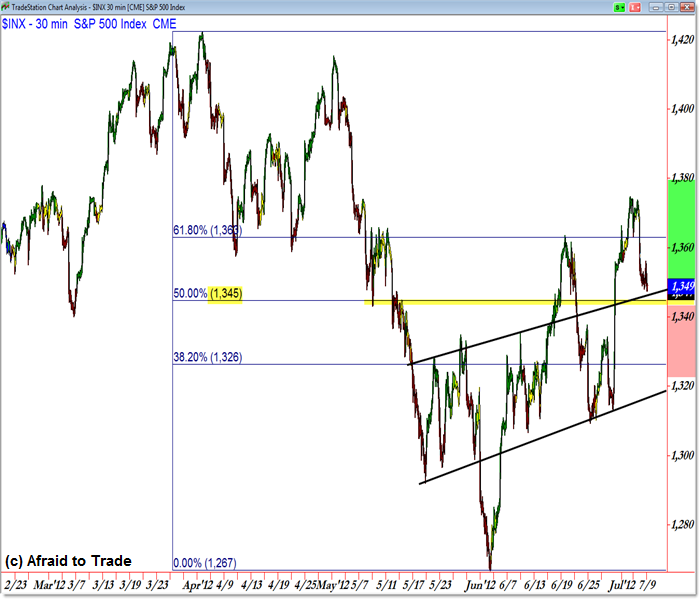
We can see more details on the intraday chart as we add a recent Fibonacci Retracement Grid:

The 50% Fibonacci Retracement as drawn rests at 1,345, roughly where price trades currently.
I drew the Green and Red pathways depending on how price reacts to this visual level:
A bullish reversal here (continue monitoring intraday charts) suggests a move traveling toward the 1,370/1,380 level while a failure or breakdown here instead opens the possibility for a continued decline toward the 1,320 Fibonacci and rising trendline (support) confluence.
For intraday/short-term traders, watch these levels and parameters closely.
Corey Rosenbloom, CMT
Afraid to Trade.com
Follow Corey on Twitter: http://twitter.com/afraidtotrade
Corey’s new book The Complete Trading Course (Wiley Finance) is now available!

Trade is the transfer of ownership of goods and services from one person or entity to another by getting something in exchange from the buyer. Trade is sometimes loosely called commerce or financial transaction or barter. A network that allows trade is called a market. The original form of trade was barter, the direct exchange of goods and services.
Trades Tool
Even though $GLD looks like a Descending Triangle and possibly bearish, could it also be a Pennant type flag/bullish pattern forming on the higher time frame, or does a pennant have to be symmetrical?