Using Market Structure to Update the Persistent Trading Range and Bear Trap
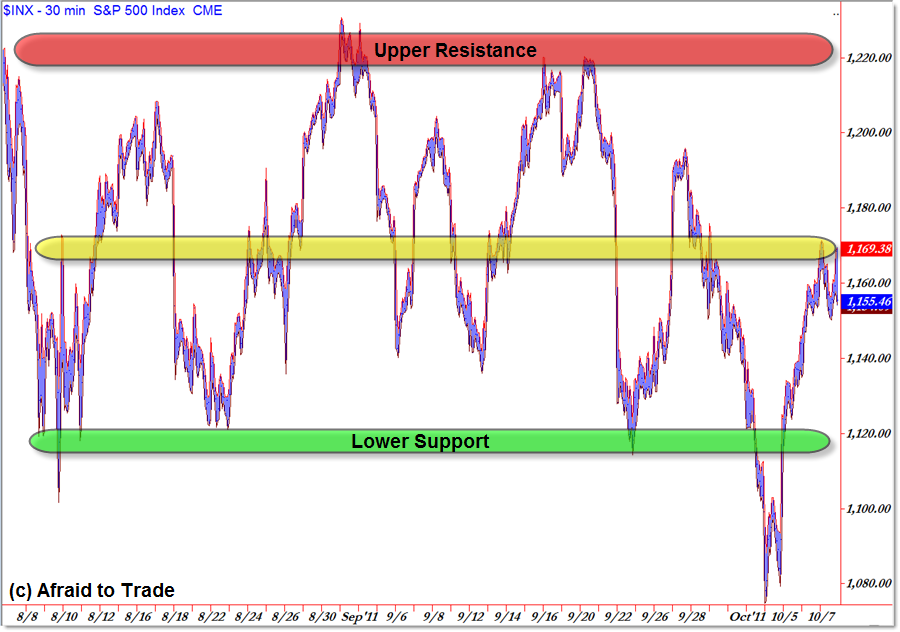
The S&P 500 – and general US Equities – have been mired in a two-months sideways trading range with clear upper and lower boundaries.
Though this week gave us a mean “Bear Trap,” price returned within the parameters of the persistent trading range.
Let’s update these levels and put this week’s ‘trap’ action in proper context:
Click for full-size image.
Take a moment to read my post last week from October 3rd that detailed the ‘bigger picture’ of the trading range – this posts serves as a weekend update.
The main idea is that 1,220 serves as the “Upper/Expensive” Resistance Line while 1,120 serves as the “Lower/Cheap” Support Line.
That makes the “Midpoint” or “Value Price” of the trading range consolidation (rectangle pattern) at 1,170.
These levels are ultimately all you need to know to develop short-term simple trading strategies (mainly for intraday or short-term swing traders).
The trades build off the premise “Expect price to remain within the confines – up and down – of the current trading range until we get a clean break and close outside a boundary level.”
No, last Tuesday’s intraday break under 1,120 does NOT count as a breakout for two main reasons:
First, price did not close under 1,120 or 1,100 – a close is necessary to confirm any breakout.
Second, price re-entered the “Lower Support” line and now trades – seemingly at resistance – at the Midpoint Price of 1,170.
We’ll officially define Tuesday’s action as a “Bear Trap” that gave a very clear caution signal on the way up.
It was fine and logical to short for a breakdown under 1,120 and 1,100 – many traders did – but when price RETURNED back into the Range Boundaries (breaking back above 1,120) it was time for sellers to take stop-losses and consider a “flip/reverse” position to play for a return to the Midpoint at 1,170.
Interestingly (or perversely, depending on your perspective), these ‘stop-losses’ helped propel price higher towards the current 1,170 Midpoint (we call this a “Feedback Loop”).
You can see how price has reacted in the last two months with respect to these levels and the Midpoint Level at 1,170 – it’s roughly equidistant from the 1,220 upper target and 1,120 lower target.
In the week ahead, a departure above 1,170 suggests 1,220 will be realized, while a continuation of the intraday sell-leg that developed into Friday’s close (resistance at 1,170) suggests 1,120 will be retested.
Given the intraday divergences, it’s easier to visualize a return to 1,120 as the more likely or probable play, but try not to get overly biased either way.
Sometimes you need to take a step back and focus on Market Structure – the price highs and lows themselves – to get a clearer picture of what the next likely play will be.
“Bare” charts like these can help you do that for any stock or market.
Corey Rosenbloom, CMT
Afraid to Trade.com
Follow Corey on Twitter: http://twitter.com/afraidtotrade
Corey’s new book The Complete Trading Course (Wiley Finance) is now available!


…or the entire bounce this week is based on lies
headed north id say.
http://mcx-advisory.blogspot.c…
i still think the DIA test 100 this month.
bank earnings will be dismal again, like in July.
Option Income System
Learn the best ways to invest your hard earned cash
http://champy06.zjaxx.hop.clic…
But on October 3, spx/inx closed at 1099.23, no? So it did close below 1120/1100. Please explain…