Viewing the Recent Shift in Money Flow Trends
While the Federal Reserve policy announcement last week shook up the intermarket money flow trends, let’s pull back the perspective to the broader trends in money flow in stocks, treasuries, gold, oil, and the US Dollar Index.
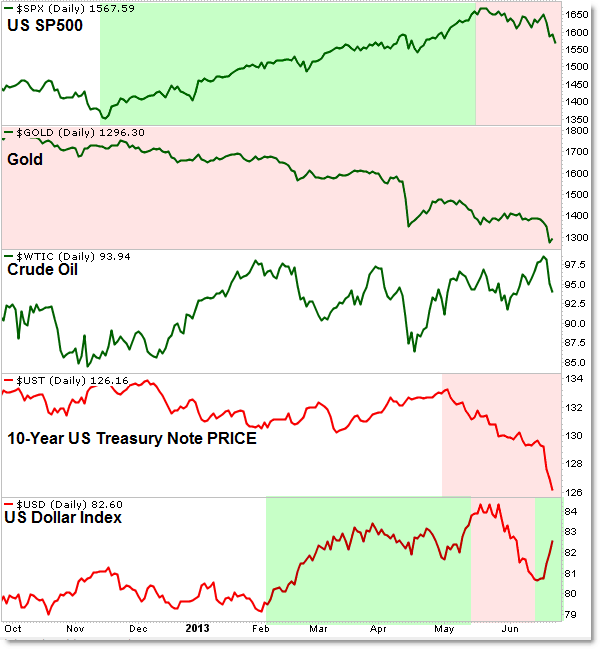
Here’s the broader picture of “Risk-On” and “Risk-Off” Money Flow:

We see five cross-markets on the intermarket landscape and we’ll note the simple trend or movement of money (money flow) among these selected markets.
Starting with late 2012, money has flown INTO Stocks (SP500), Crude Oil, and (ironically) the US Dollar Index.
Money has flown OUT OF Gold (undeniably) and the 10-Year US Treasury Note (and bonds in general).
May 2013 reflected a recent visual shift in Money Flow to reflect the following:
Money Flow reversed OUT OF Stocks and (temporarily) OUT OF the Dollar.
Crude Oil remained in a visual range, reflecting flat or neutral money flow though a “Bull Trap” occurred just ahead of the recent downside reversal after the Federal Reserve meeting last week.
Money continued to flow OUT OF Bonds/Notes (Treasuries) and Gold.
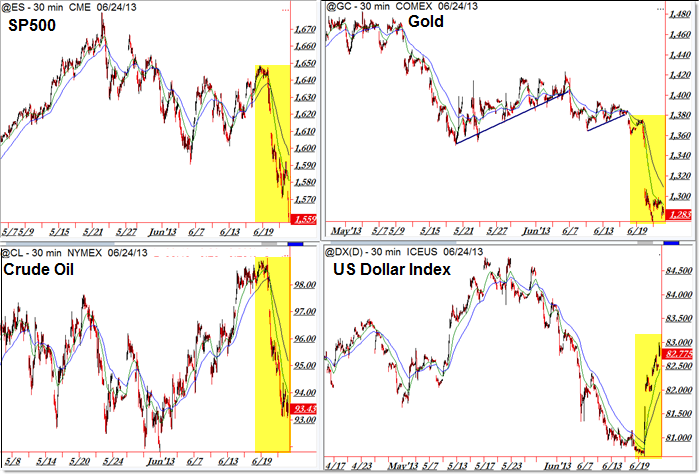
Let’s zoom in on the recent development before and after last week’s decisive Fed Policy Announcement:

I highlighted the immediate action around the US Federal Reserve Policy announcement which discussed future “tapering” or reducing the cross-market stimulus provided by the bond/mortgage-backed securities program (QE3).
The intermarket money flow landscape reacted as would be expected from a future reduction in stimulus:
Stocks, Gold, Treasuries, and Oil fell (sharply) while the US Dollar Index rallied powerfully.
For now, we’ll use the upcoming price activity to get a sense of whether we have a lasting shift or reversal in money flow (see broader chart above) or whether the recent sharp shift is merely a ‘correction’ within the context of ongoing trends.
We’ll specifically be monitoring Stocks as they move “Away From” 1,600, Oil as it moves “Away From” $99/$100 and of course Gold moving “Away From” (either on the downside or back above) $1,300.
If you’re interested just in following the money flow within the Stock Market itself, check out today’s update on Sector Rotation Money Flow in the Stock Market (June).
Join fellow members to receive daily commentary and detailed analysis each evening by joining our membership services for daily or weekly commentary, education (free education section), and timely analysis.
Corey Rosenbloom, CMT
Afraid to Trade.com
Follow Corey on Twitter: http://twitter.com/afraidtotrade
Corey’s new book The Complete Trading Course (Wiley Finance) is now available along with the newly released Profiting from the Life Cycle of a Stock Trend presentation (also from Wiley).


6 Comments
Comments are closed.