Watch Your Gaps and Traps this Week
For intraday and short-term traders, the recent week has been abnormally more “gappy and trappy” than normal.
What do I mean and what can we do about it? Let’s take a look at the intraday chart:

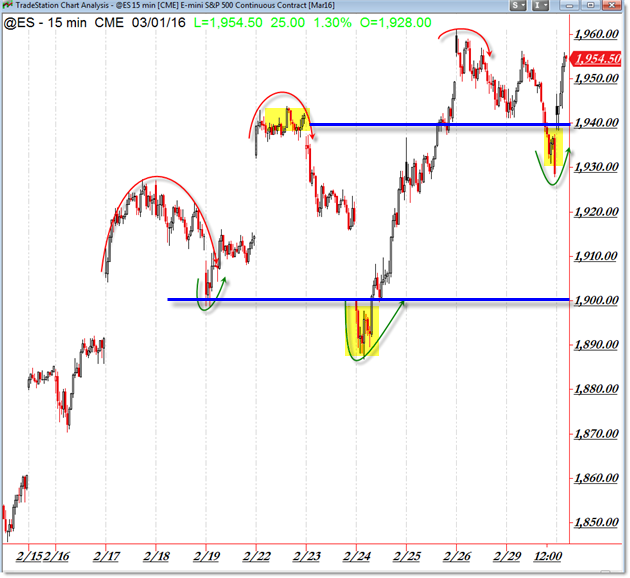
Here we see the simple @ES Futures on the 15-min intraday chart.
Key inflection (pivot) levels include the obvious 1,900 and the lesser-known 1,940.
I’ve been repeatedly highlighting these levels – and trading plans – to members along the way.
Markets are either stable or unstable, flat or volatile.
We’ve moved into an environment of short-term instability, characterized by “Gaps and Traps” recently.
A gap is a large supply/demand imbalance that occurs overnight, or before the opening bell.
It’s when price rapidly moves higher or lower (on the open) from the prior close.
A “Trap” occurs when price initially breaks through a key level – for example, under 1,900 – and then rapidly trades back through it (like on February 24th).
The recent environment has been more prone to these tricky events lately, as seen above.
Generally, a trap is a frustrating event that skilled, nimble traders can parlay into a quick profitable win.
Usually when price initially “probes” through a level but reverses back through it, it leads to a sustained swing away from the “trap” level.
This is due in large part due to stop-losses (of the losing side) triggering.
As you plan and trade the beginning of March, just know that we’re in an unusually “Gappy and Trappy” environment.
Corey


One Comment
Comments are closed.